SuperNova Minimus Speaker Build
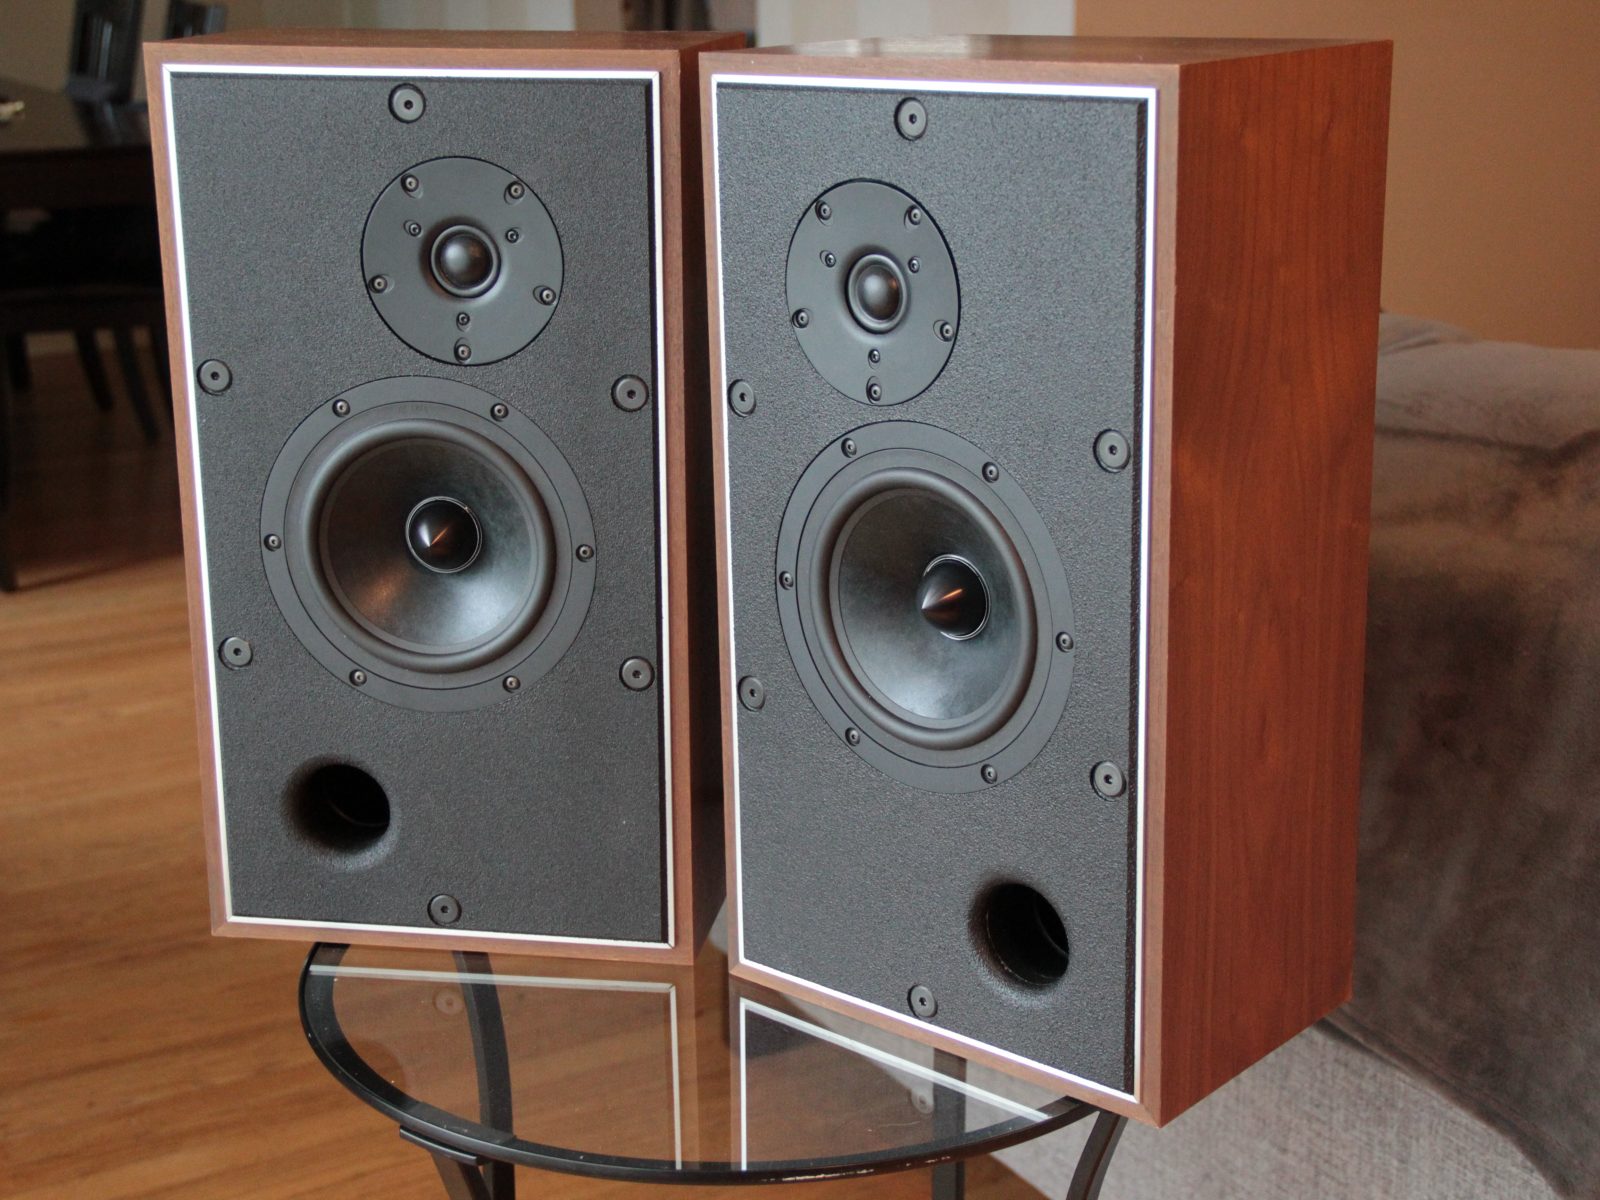
SuperNova Minimus, a vintage Realistic Nova 15 re-design.
Why build this?
The main purpose of this build was to revitalize a pair of Realistic Nova 15 cabinets from the mid 80’s. The cabinets have been in my family for nearly 35 years and were in great shape. Rather than fabricate a cabinet from scratch, I figured these would make a good bookshelf format cabinet for modern drivers with about ½ cubic foot of internal volume.
The end result will be a classic 2 way speaker with excellent characteristics in an updated vintage format. This goal was to get a good crossover with a simple circuit utilizing only 5 parts, dictated by a DIY competition InDIYana 2019.
Driver Selection
The Peerless DX25BG60-4 tweeters were found in a Parts Express sale and chosen for their robust build including double magnets and a rear chamber for a low Fs. The 1 1/8” diameter dome is able to easily perform to below 2kHz and will mate with a larger mid-bass easily.
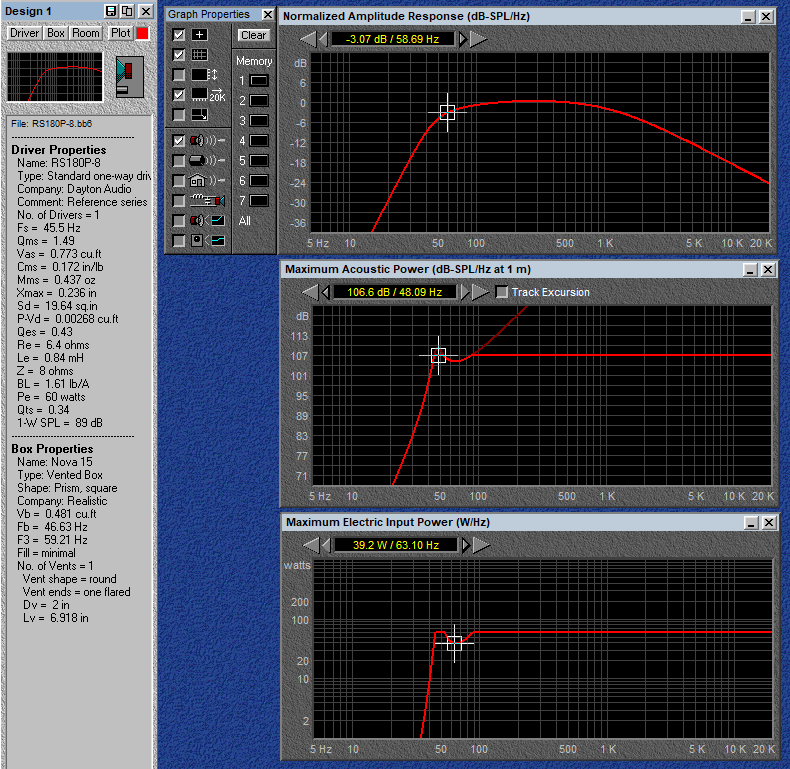
The Dayton RS180P-8 was chosen for the mid-bass due to its well controlled high frequency roll off and low distortion. With a low part count crossover requirement, it was important to have a well behaved woofer with as little cone break up distortion as possible. Some modeling using the Dayton files processed for baffle simulation with response modeler and WinPCD tested well with a simple crossover.
A ported alignment for the RS180P-8n in just under ½ cubic foot worked well, with only a minor Xmax limit under the 60W thermal limit. Bass box predicted an F3 of just under 60Hz, matching the original Nova 15 specification. It’s aluminum cone brother the RS180-8 would perform with better bass in this cabinet, but would definitely require more than 5 parts to tame the high end.
Enclosure Design
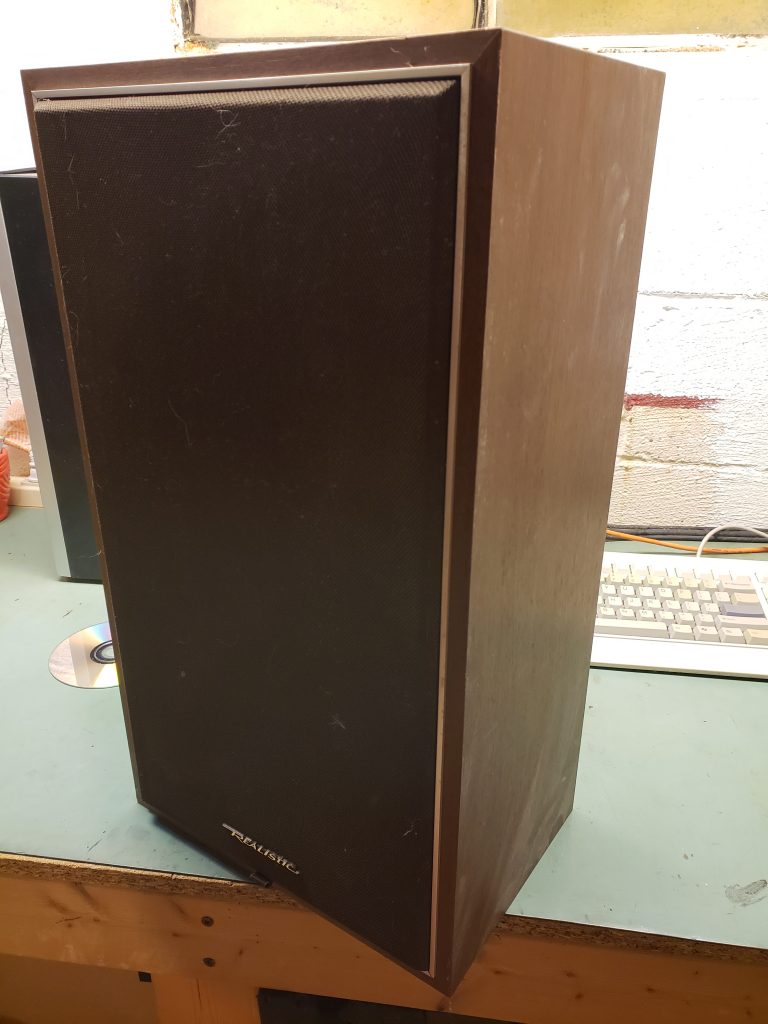
Realistic original grill 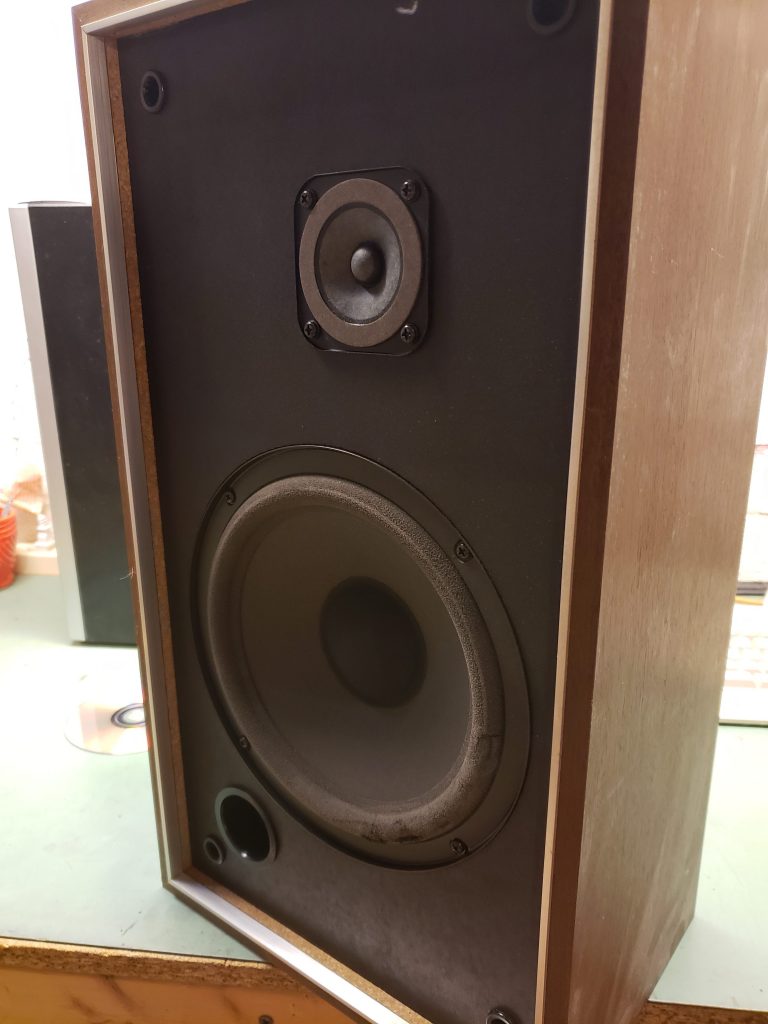
Realistic originals
The Realistic cabinets were originally equipped with a plastic framed grille that inset just over ½” in behind an aluminum trim ring.
Enclosure Assembly
After removing the original drivers, I simply used a reciprocating saw to remove the original 5/8” particle board baffle. A lip of just over an inch wide was left for mounting a new baffle.
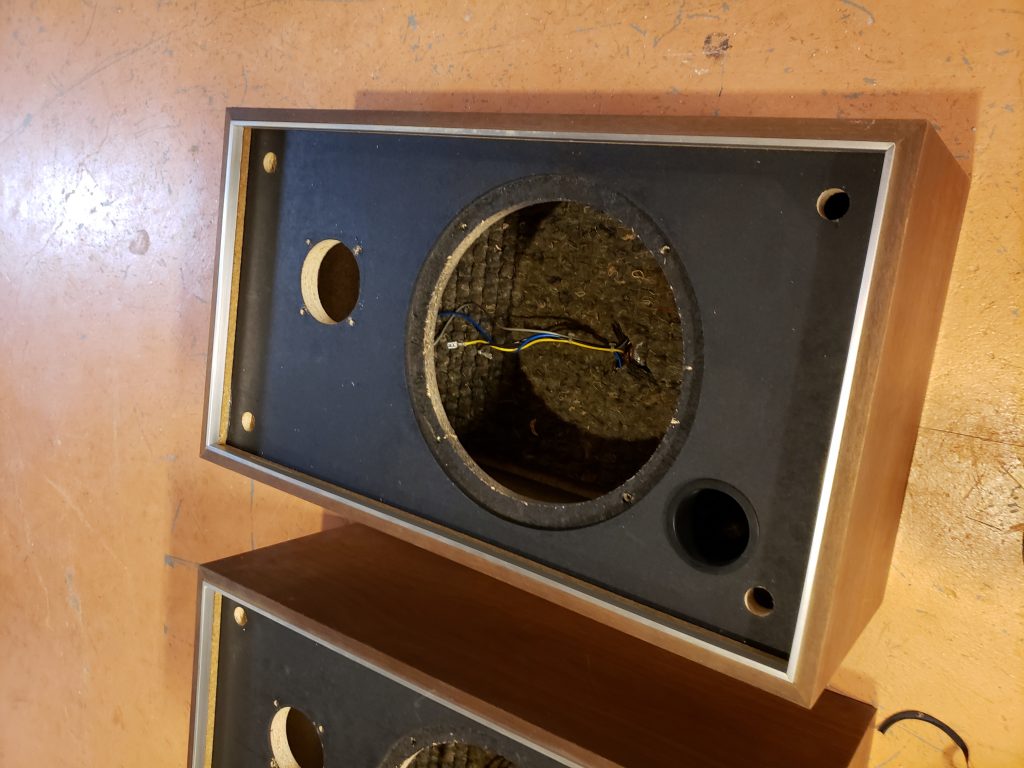
Original baffles, hardware removed. 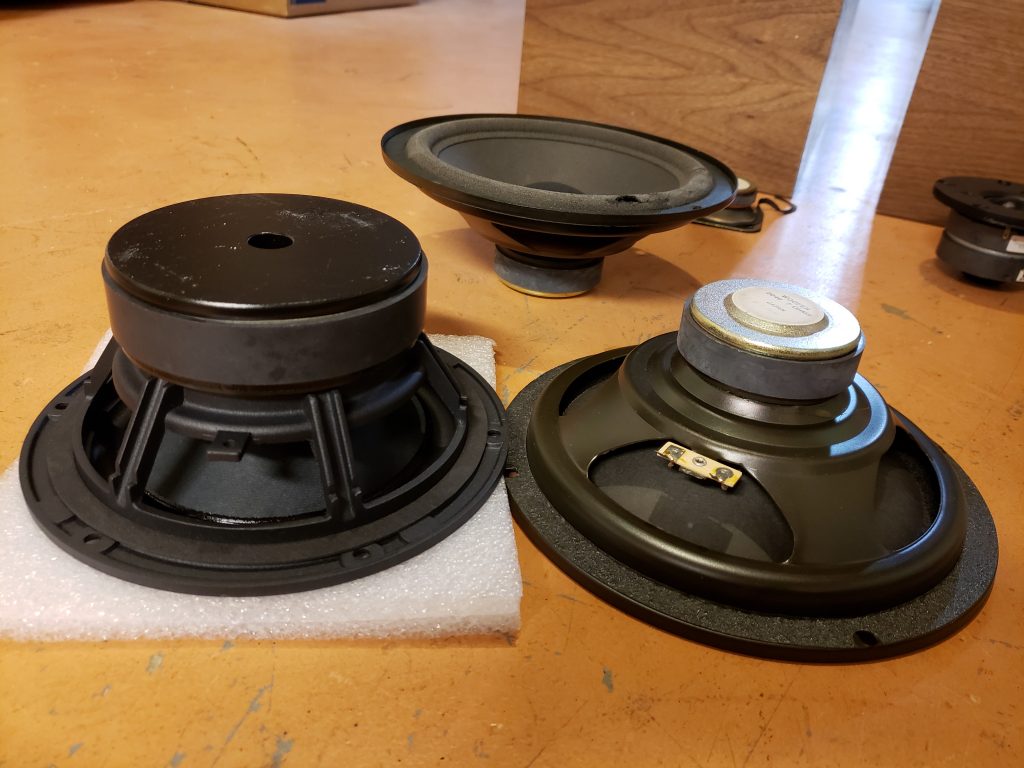
RS180P-8 vs. Realistic original woofer 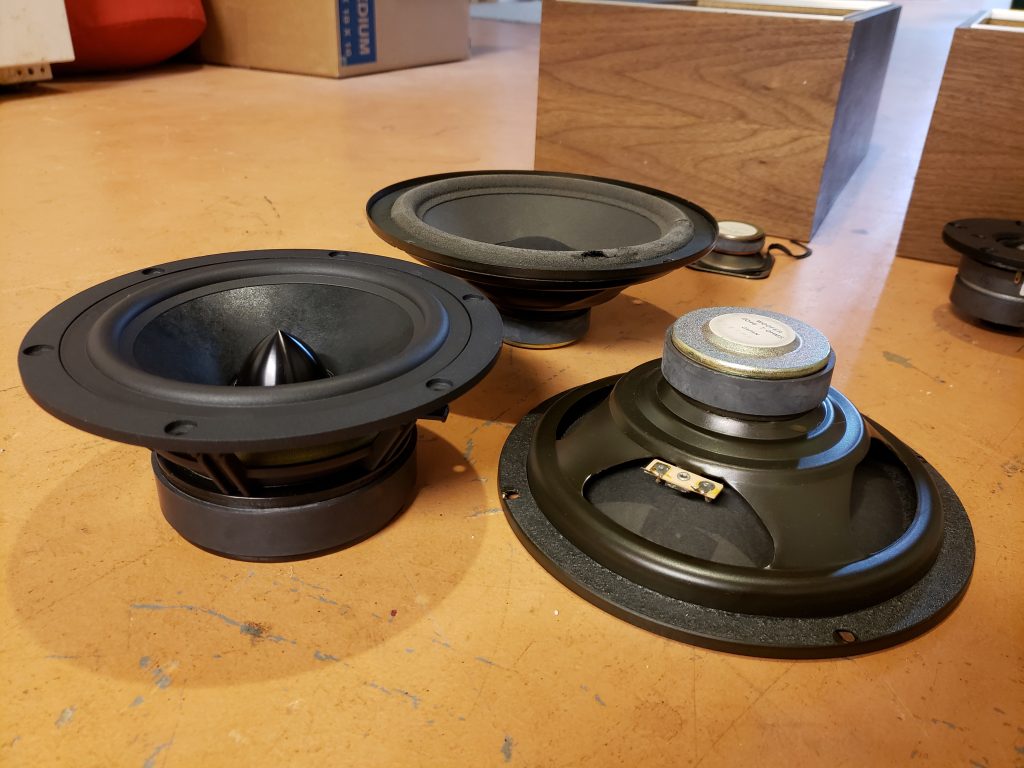
RS180P-8 vs. Realistic Original 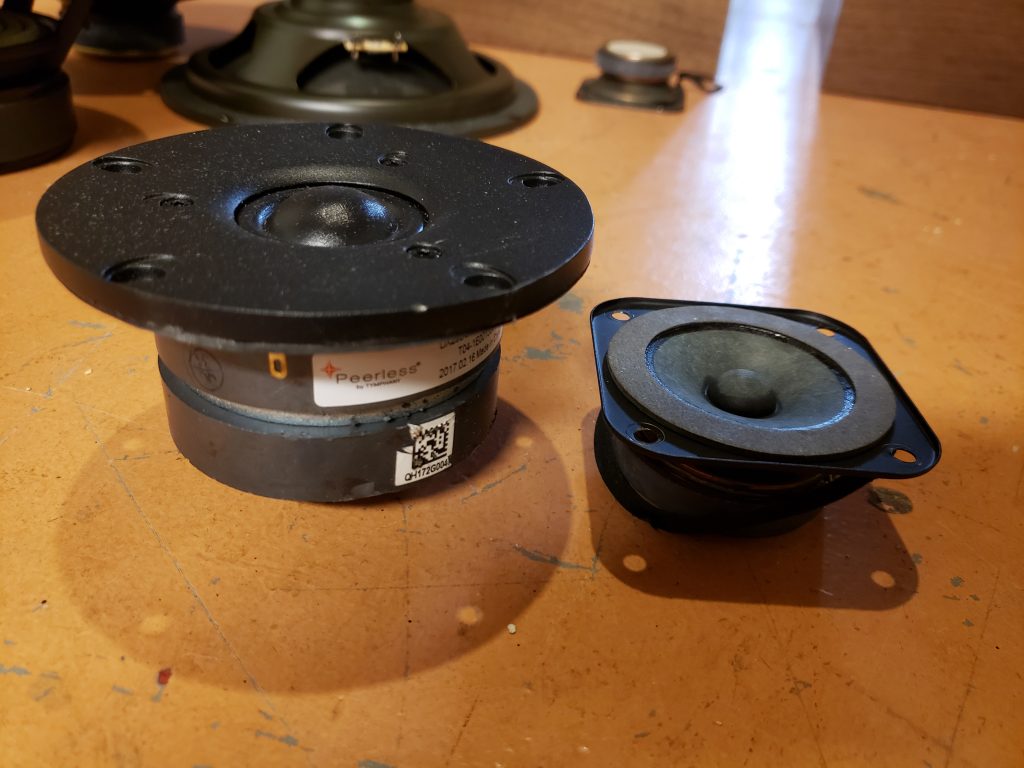
Peerless tweeter vs. Realistic original 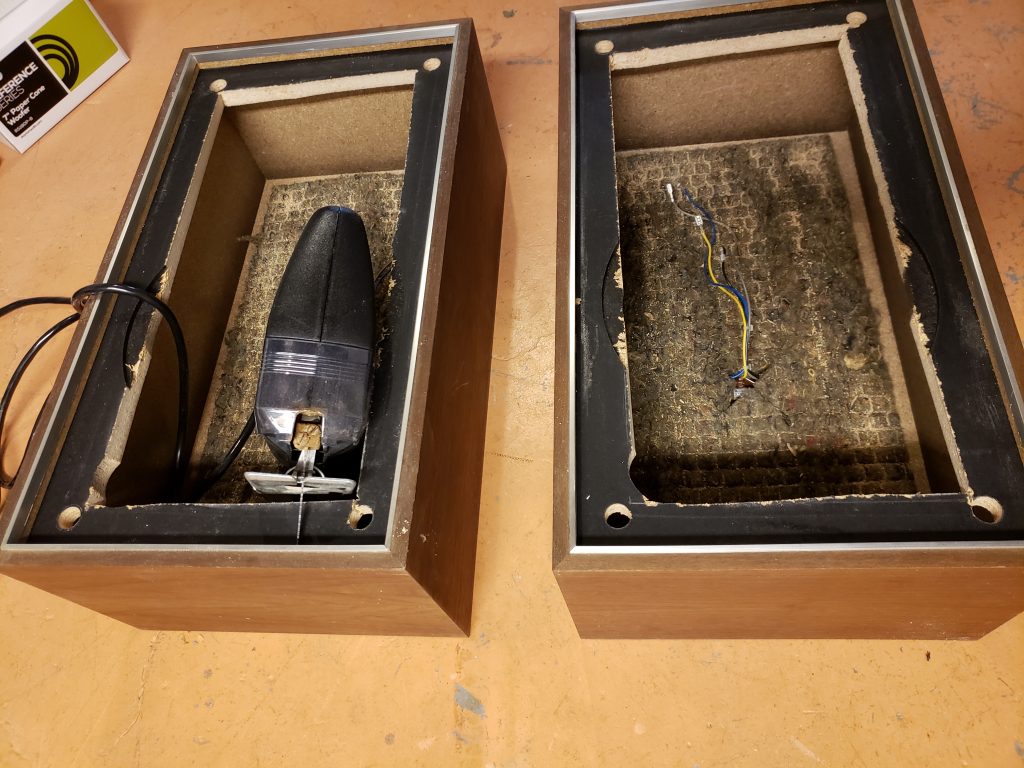
Original baffles removed.
The new drivers were laid out, and cut into a ¾” MDF baffle board. This board, with a small chamfer to blend with the original aesthetic would be installed removably to allow redesigns later.

Blank baffle fit test 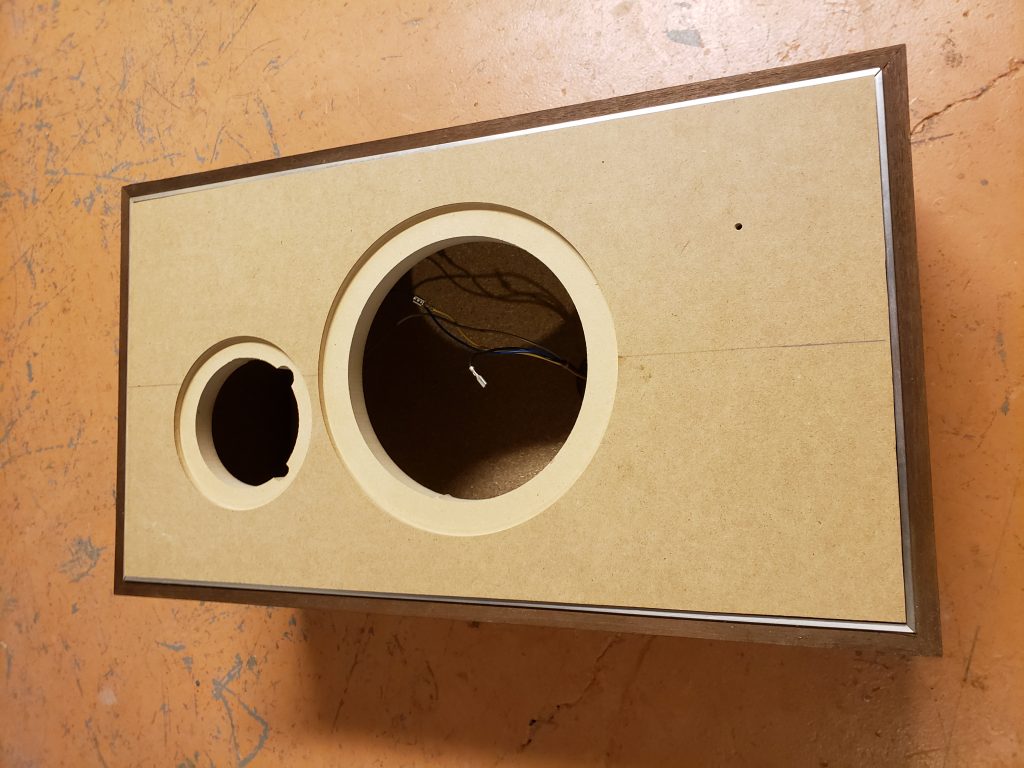
Woofer and Tweeter routed. 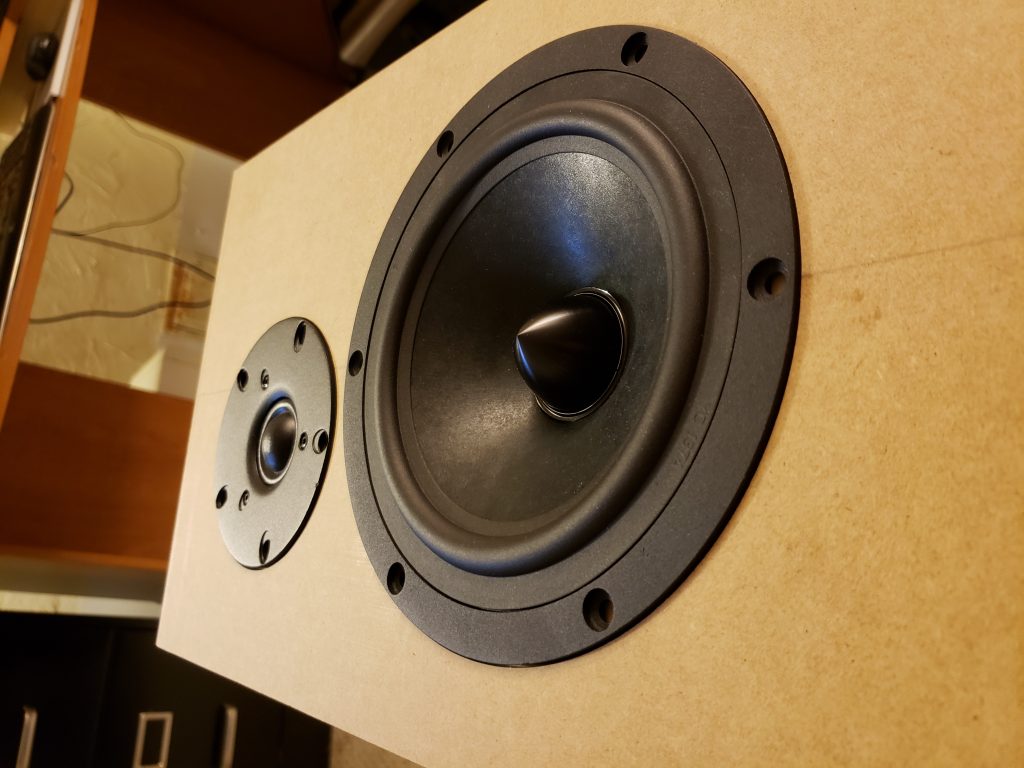
Woofer and tweeter fit test. 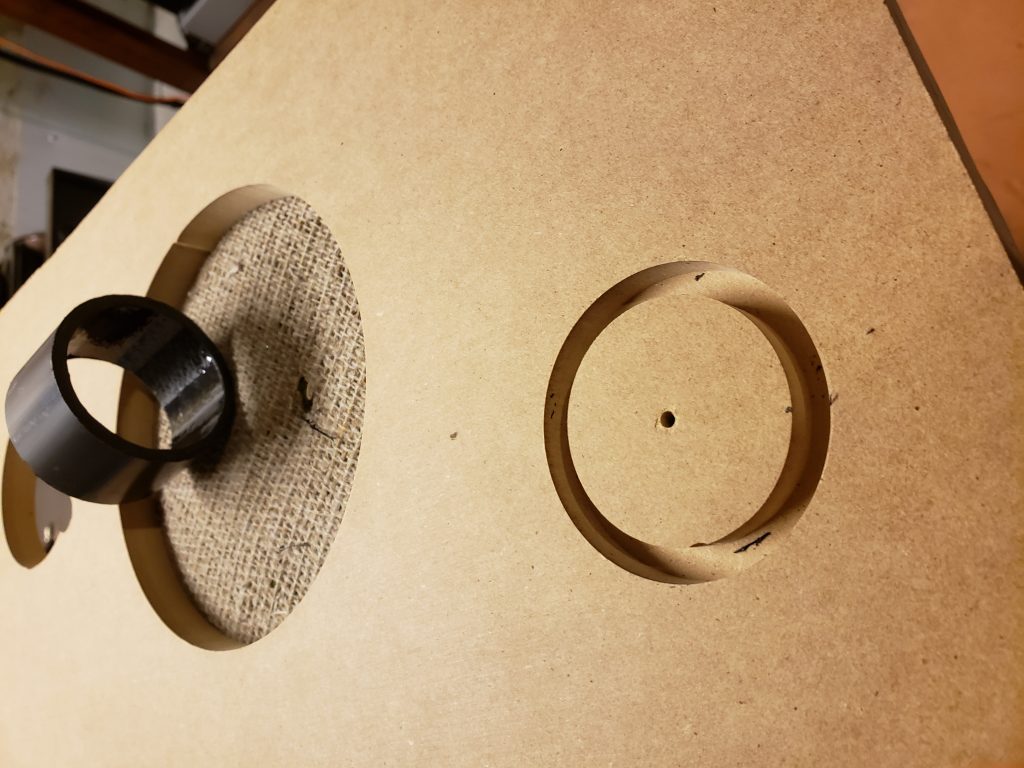
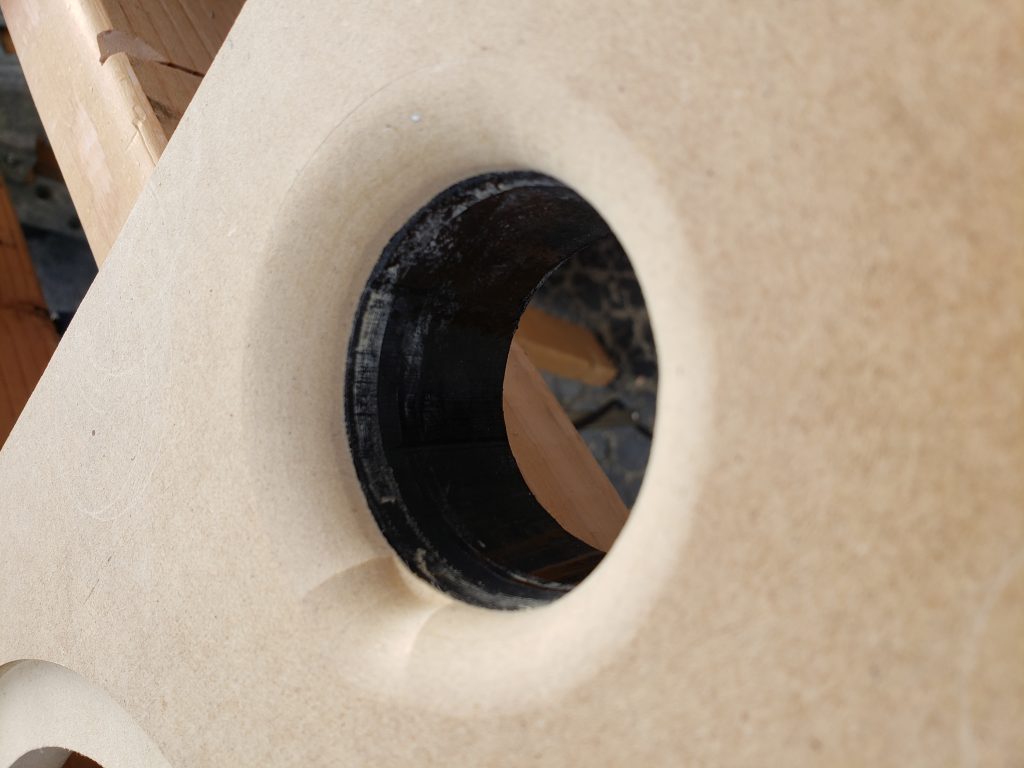
1/4″ route for port tube. 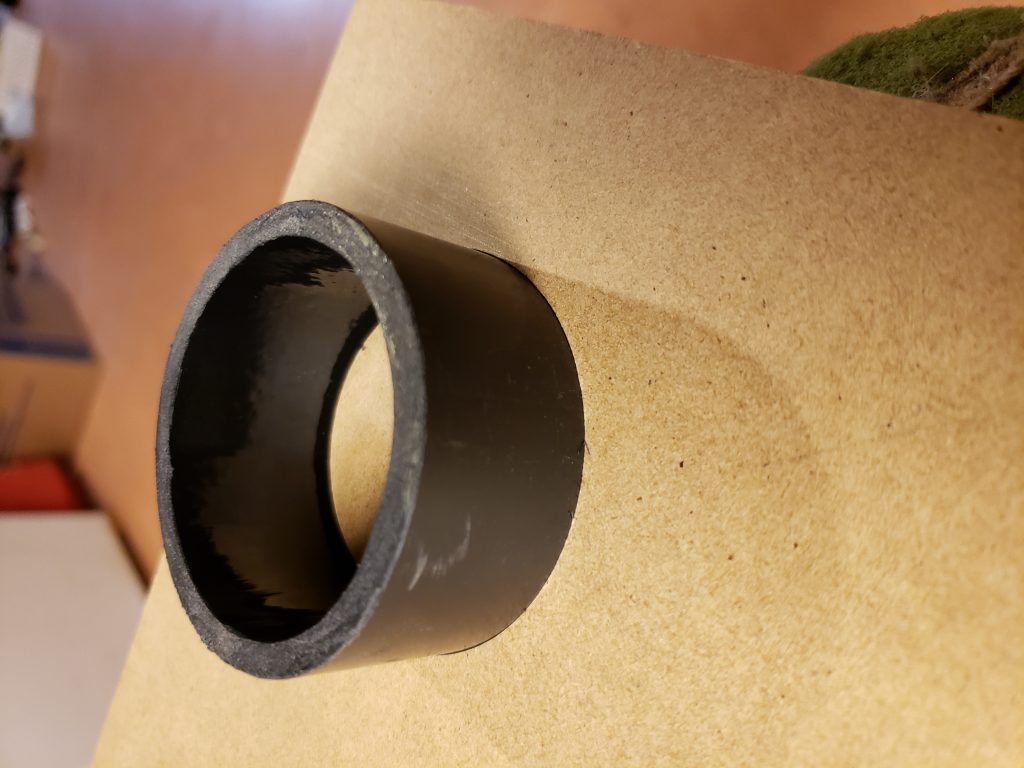
Port tube installed in rear of baffle. 
Straight bit trimmed port, ready to round. 
Perfect port.
The port design will use a 2” internal diameter PVC port with a 90 degree slow sweep elbow to allow extension for lower tuning as needed.
The original enclosure was made from ½” stock, which is pretty weak by modern standards. To compensate, 45 degree braces joined the sides and back for extra rigidity. These were cut with a miter saw out of 1×2 pine. This tightened up the cabinet walls and reduced resonances for the finished speaker.

Braces ready for installation. 
Cabinet bracing 
Symmetric bracing plan. 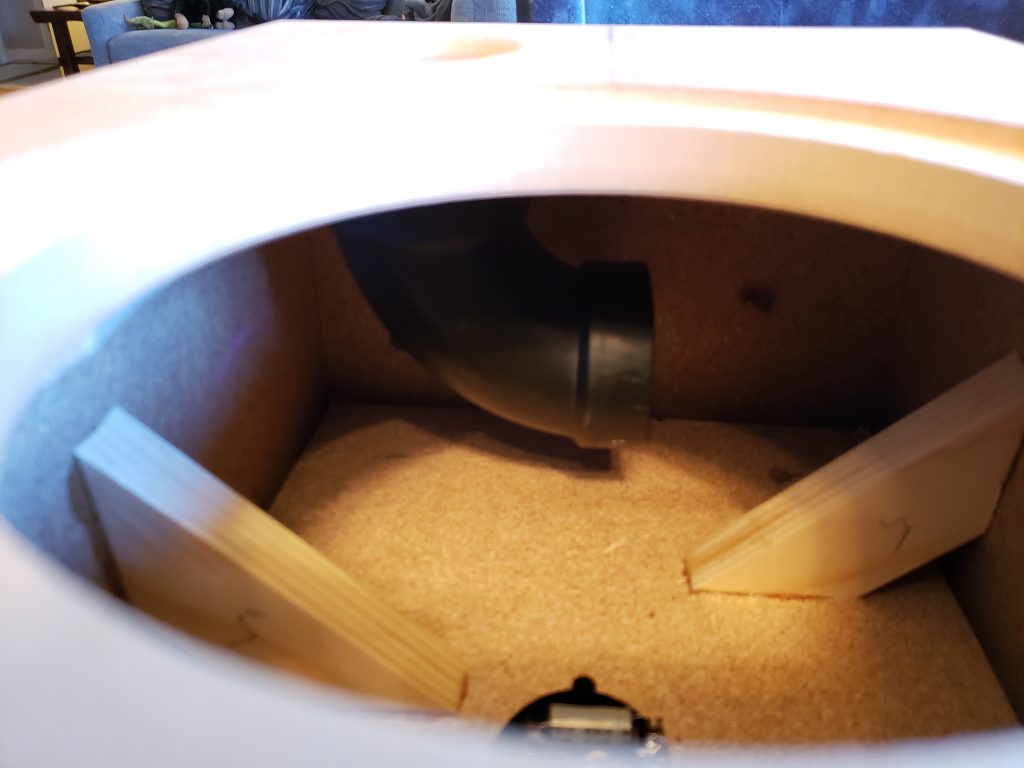
Port elbow clearance 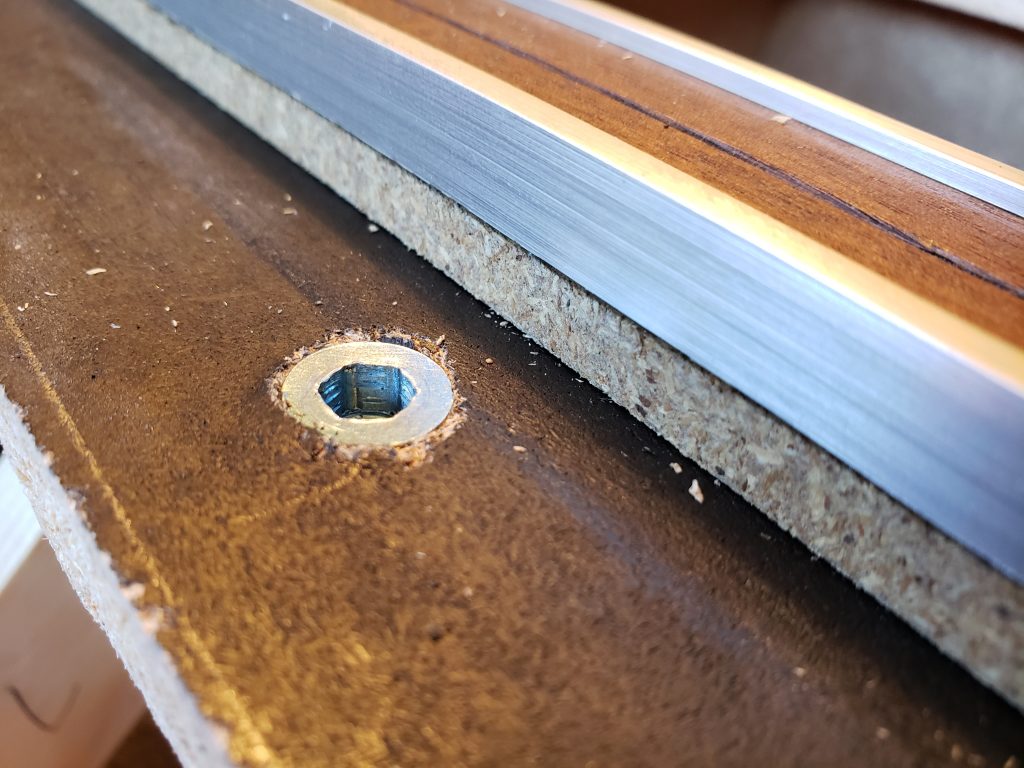
1/4×20 insert nuts installed. 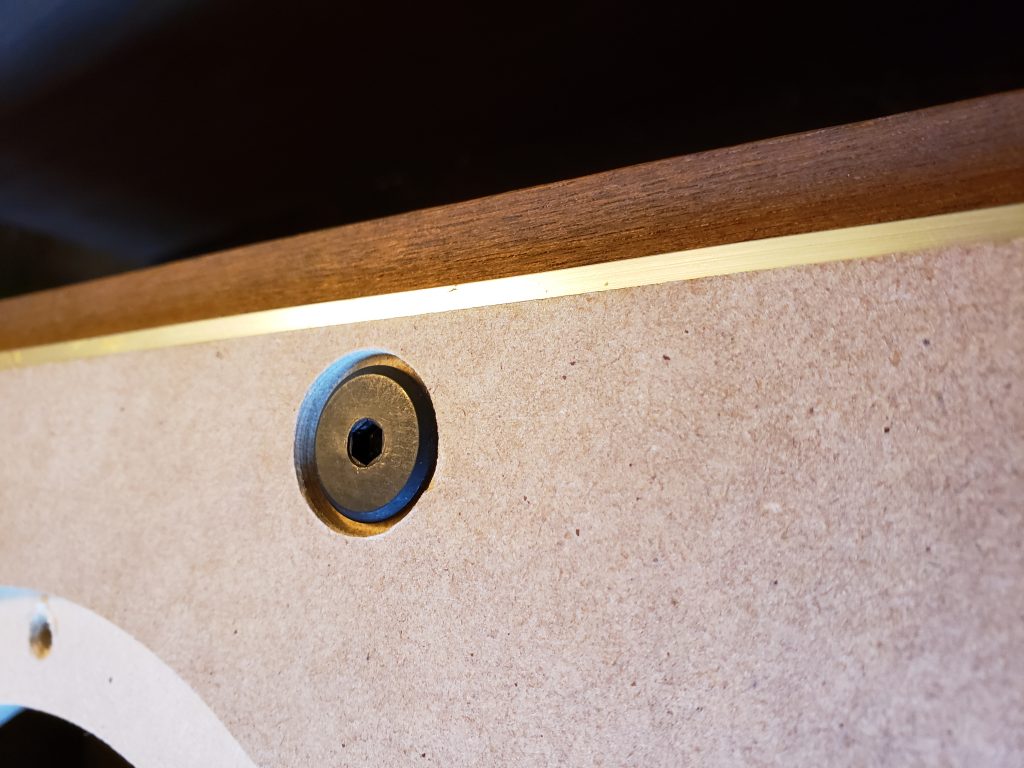
Good example of centered mount hardware.
The baffle was routed to flush mount all drivers and drilled to mount to threaded inserts installed in the original baffle wood.
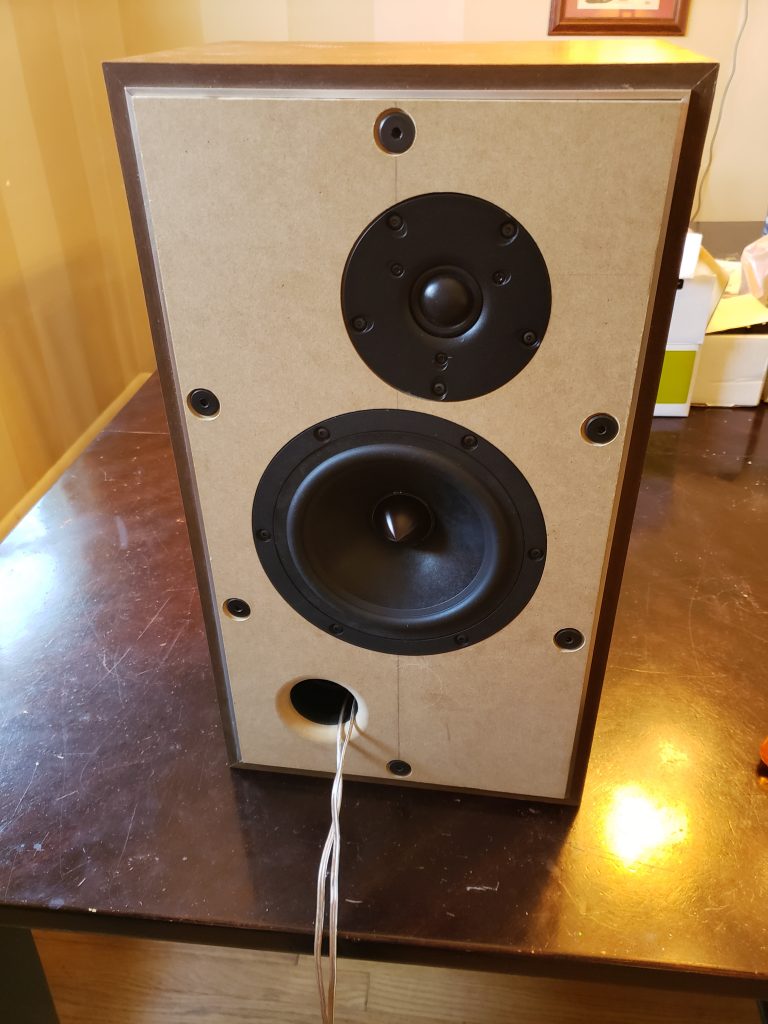
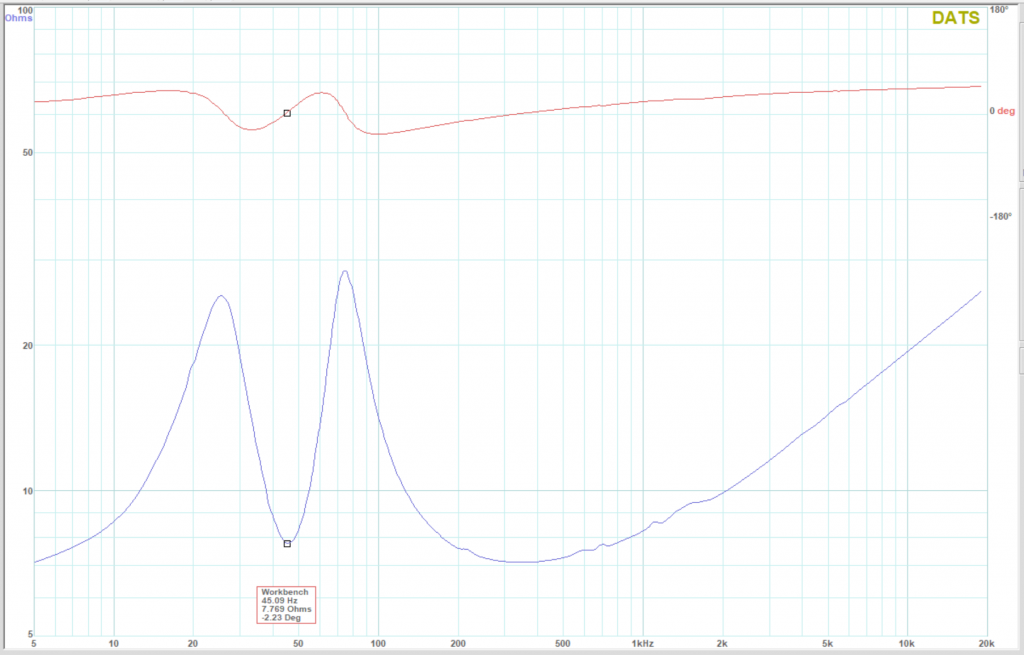
With the test baffle in place, the tuning was verified using DATS as 45Hz without any extension of the port past the 90 degree elbow.
This was installed without finish to capture measurement data to design the crossover circuit.
Measurement Setup on the cheap
My super budget setup includes only an iMM6 microphone and my trusty Microsoft Surface Pro 3. The iMM6 plugs right into the headset jack and becomes available as an audio input and output in Windows. For my application, I’m using ARTA for measurements.
Every iMM6 comes with a calibration file that you need to get from Dayton by following the included instructions, load that as FR compensation under the Setup – FR Compensation menu.
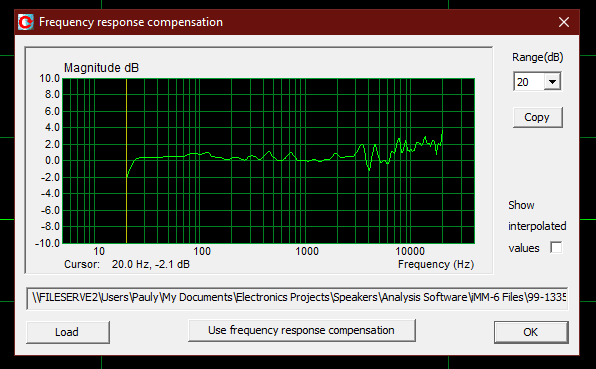
Once loaded, click “Use frequency response compensation” to apply the calibration to your measurements.
With the Surface Pro, since it’s essentially a tablet, I use a basic music stand to get the mic at tweeter height and set it up by eyeballing the tweeter axis and measuring the appropriate distance. For this project I used 1M, 39” but you could go closer provided you’re in the far field. A white paper by Jeff Bagby details this measurement technique very well.
With this all set, you’re ready to make measurements. The Impulse response measurement / signal recording screen is where you’ll be.

Here are my recording settings, the sequence length is pushed up from default to 128k, but everything else is default. For distortion measurements, the “Center peak of impulse response” check box is required, but I found that changed the location of the gate settings so that was left unchecked for this project.
I setup the level by switching to the periodic noise tab and firing up a pink noise signal. I then used the Audio Tools app on the phone with the iMM6 to set the average level to 80dB for the woofer. Now the goal is to leave the amp level, mic position, and resulting gate settings alone for all measurements.
The measurements were made in this sequence:
- Tweeter alone
- Woofer alone
- Woofer + tweeter in parallel
It’s super important to leave all settings the same for these measurements, they will be used to find the Z axis offset later.
Once the impulse is taken, set your gates with a left click for the beginning, and a right click for the end of the impulse right before any visible reflections. Click the “DFT” button (Unsmoothed DFT Frequency Response / Spectrum) to get the results. This is where you’ll export an FRD file. Make sure you change the view menu to “Magn+Phase”, otherwise your FRD file will not contain any phase data.
Click File – Export – ASCII file to save your data. This will spit out a “txt” file, which will need a little editing and a rename to be useful. In Notepad, delete the top comment lines, leaving only the numbers. Then change the file extension from “txt” to “frd” for use in other programs.
Level calibration issues
Since I don’t have any level calibration with this setup, the output of the response measurements sit in the negative dB territory rather than at actual SPL. This doesn’t affect the response curves, but throws PCD for a loop and can’t be used. So the dB values need adjusted to fit in a program. This can be done with Excel.
Use the import text tool to bring in the FRD data into Excel, it is tab delimited text. Once you have the data in there, the first column is frequency, followed by amplitude and phase. I used formulas to mirror the 3 columns over, and added a fixed number to the amplitude of 80dB to bring them up to a useable level. This doesn’t relate to a real SPL level, but that doesn’t matter so much for the crossover design. To save back out of Excel, simply copy and paste your 3 updated columns into Notepad. By default, Excel data is pasted as tab delimited when it goes into text, so it will be ready to use. Just save the contents as a new adjusted FRD file.
Crossover Design
With actual measurements exported and processed as FRD files and the impedance data saved using DATS as ZMA files, the crossover was designed using WinPCD.
To use the data in WinPCD you have to determine the Z offset for the drivers. Initially I used the gated results, and did not bother adding in close mic data below 300Hz. So at first my graphs were invalid under 300Hz.
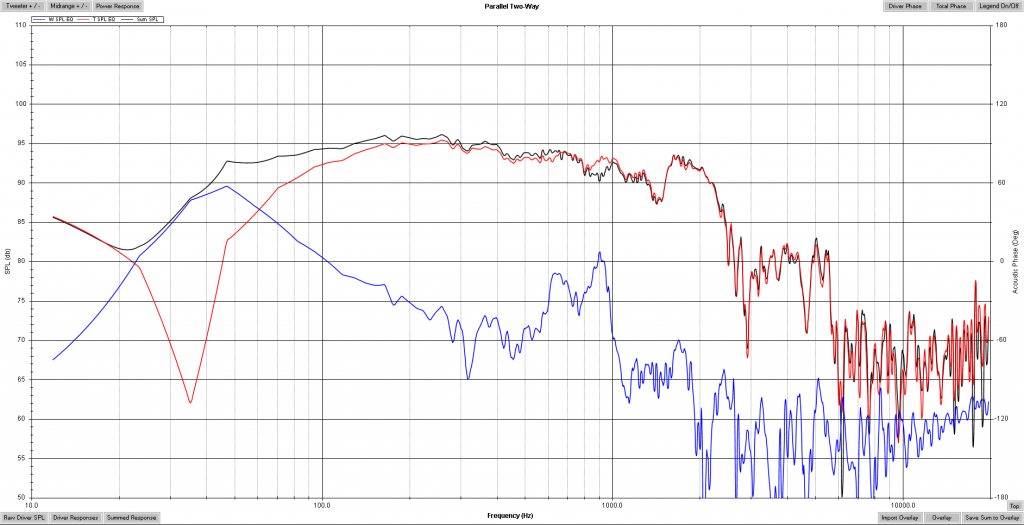
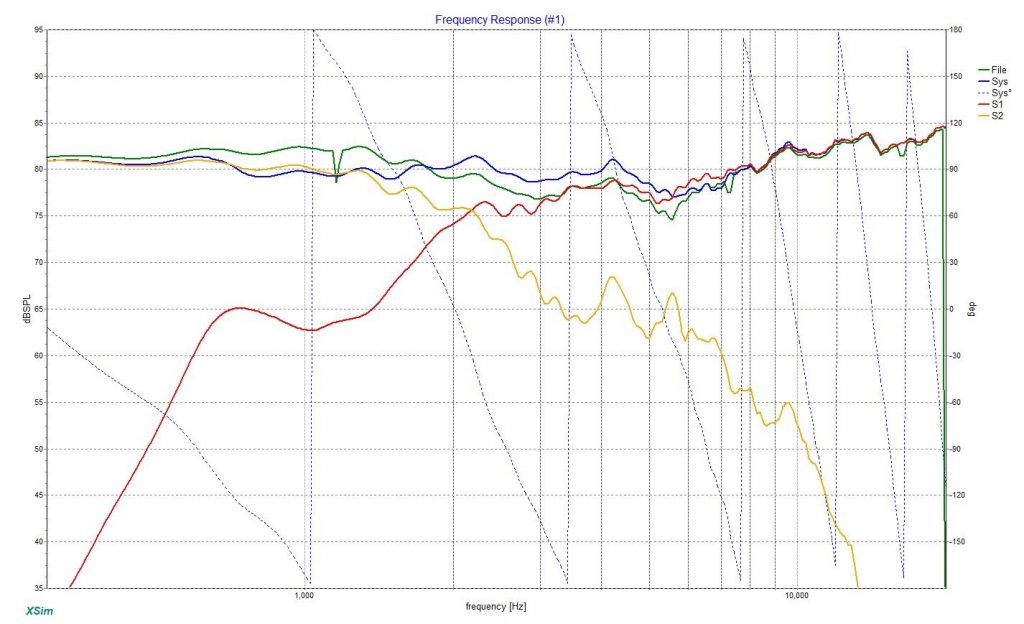
Finding the X offset requires you to compare the measured combined response with the sum generated by software. First add your woofer and tweeter FRD files and let them run full range without any crossover selection. Then in the System Response Graphs window, click Import Overlay and pull in your combined measurement FRD file.
This is my driver set example. Note the little notches in there, those coincide with funny phase blips in the FRD file, I’m ruling those out as not real.
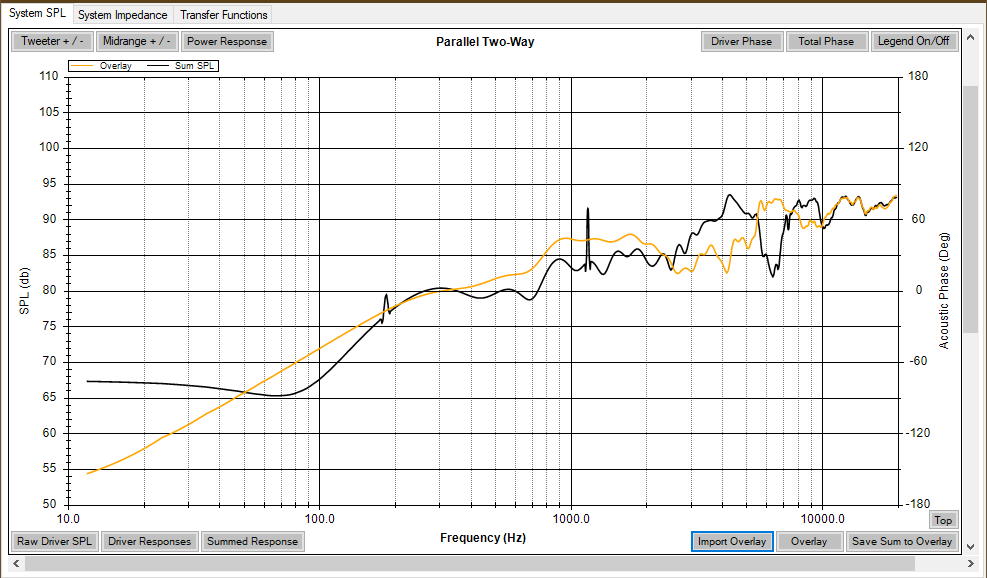
Next, make sure the “polars active” button is on and start moving the woofer Z value. You can do this with the up and down arrow keys, leaving the system response graph on the screen so you can watch it change real time. Once you hit the right Z value the system response will align with the measured combination. In my case it looked like this:
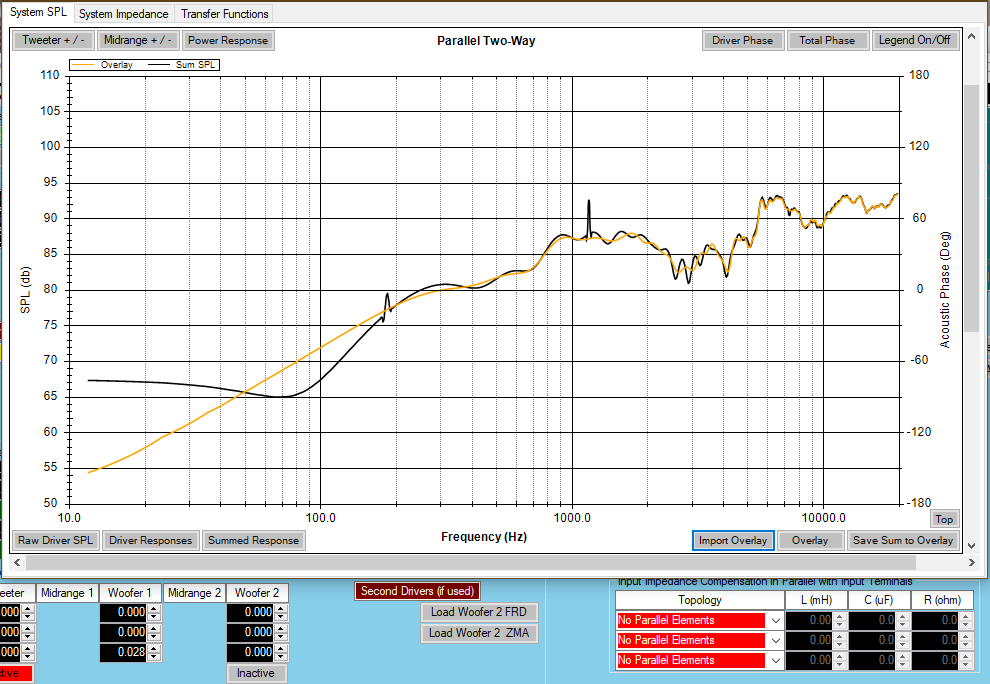
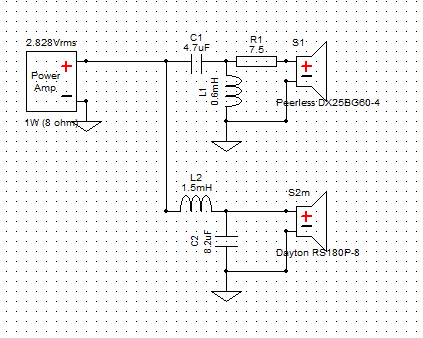
That shows a Z value of 0.028 for my drivers, about 1.1 inch. That seemed high but reasonable for a flush mount dome to a RS180P woofer. And now I’m into crossover design, limited to 5 components. For targets I shot for 2nd order butterworth, but really that flies out the window when I’m avoiding extra components. So the process was a trial and error loop, sticking with second order electrical on the woofer and tweeter with a single series pad resistor on the tweeter.
Crossover Testing
The design took 2 iterations of parts to land on a flat response for use in open space on a stand, fully compensating for the baffle step loss in the low frequencies. The first attempt was done without close mic measurements, and missed the bass by not adequately compensating for baffle step.
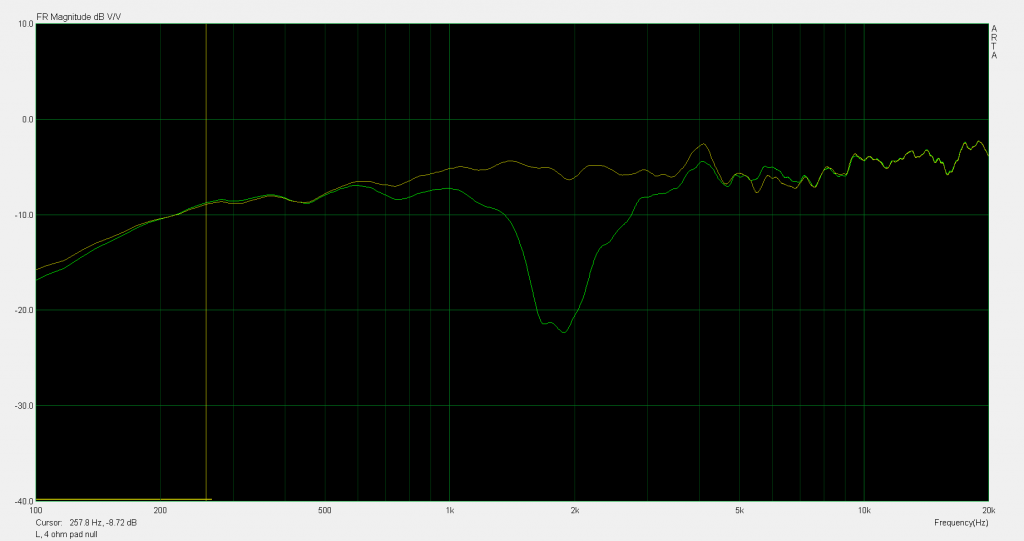
Each design iteration was confirmed with quasi-anechoic gated measurements including a reverse polarity test on the tweeter. If the phase alignment is correct with the woofer and tweeter, reversing the polarity will cause a deep dip in response at the crossover frequency indicating the drivers are in alignment and cancelling each other at the measurement point.
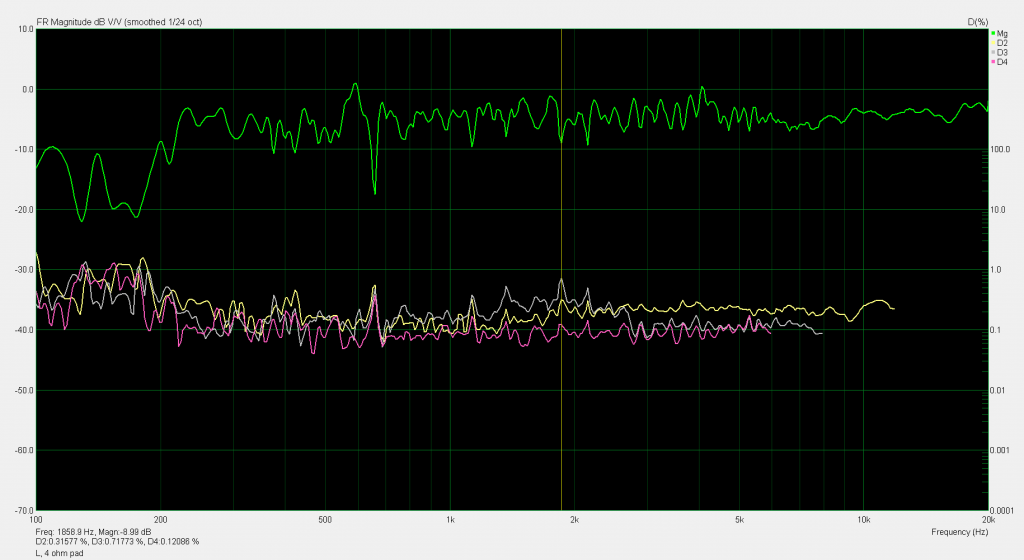
Distortion was tested using ARTA and found to remain well under 1% throughout the frequency range.
After some music listening proving the low frequencies a little too weak for my taste, I added the close mic measurements of the woofer cone and port and made a composite response output for use in the crossover design.
This combination showed the weak baffle step compensation that was implemented by not keeping the 300Hz level above the minimum near the mid point of the frequency response range. Altering the values again corrected the situation.
Cabinet Finishing
After the crossover design was finalized, a Duratex finish was rolled on to contrast with the original walnut veneer of the Realistics. Some damping material was stuck to the back and bottom of the cabinet to minimize internal midrange and resonances from exiting the port. Finally, the connection terminals were upgraded to allow connection with banana plugs.
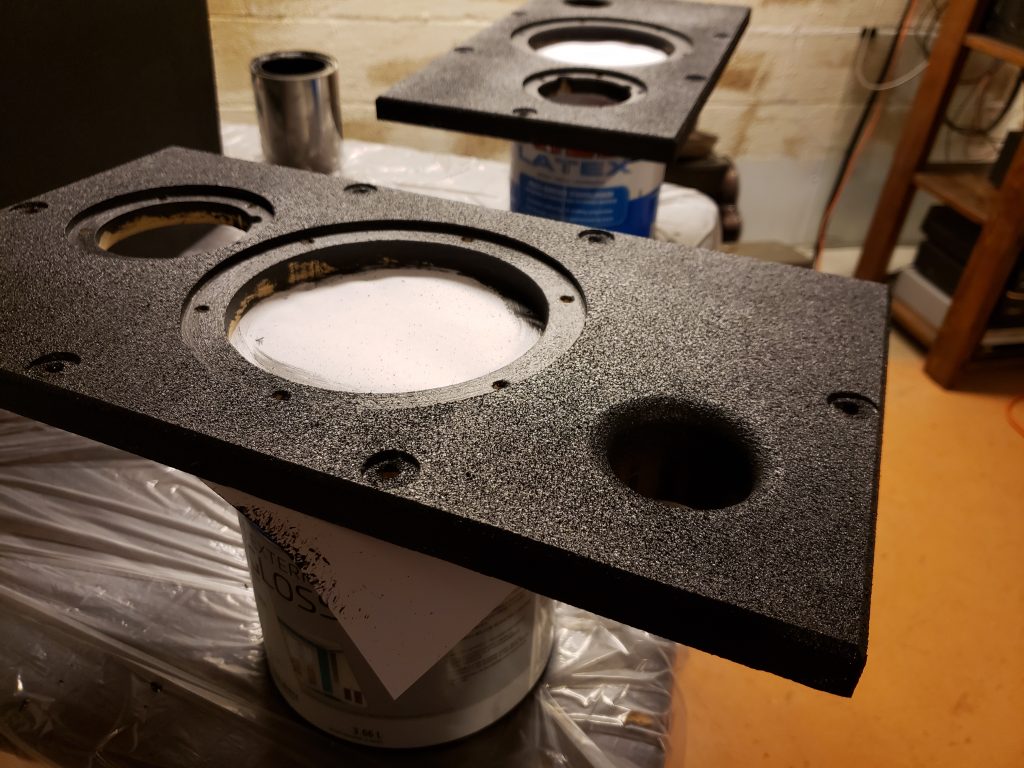
Duratex in process on the baffles. 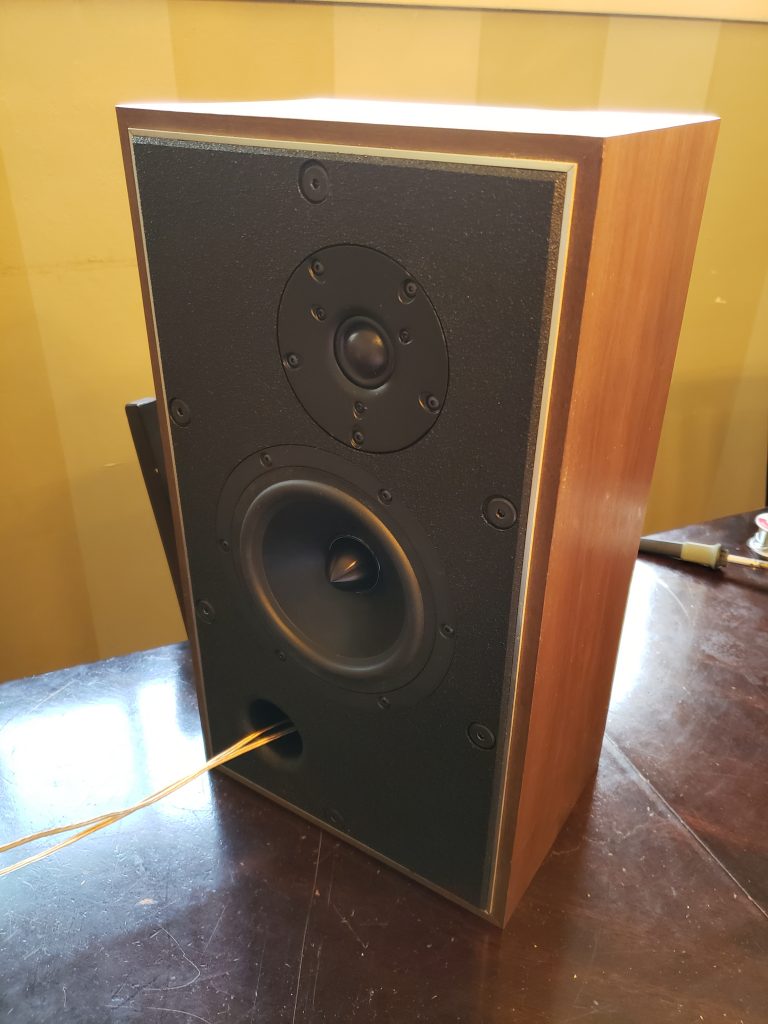
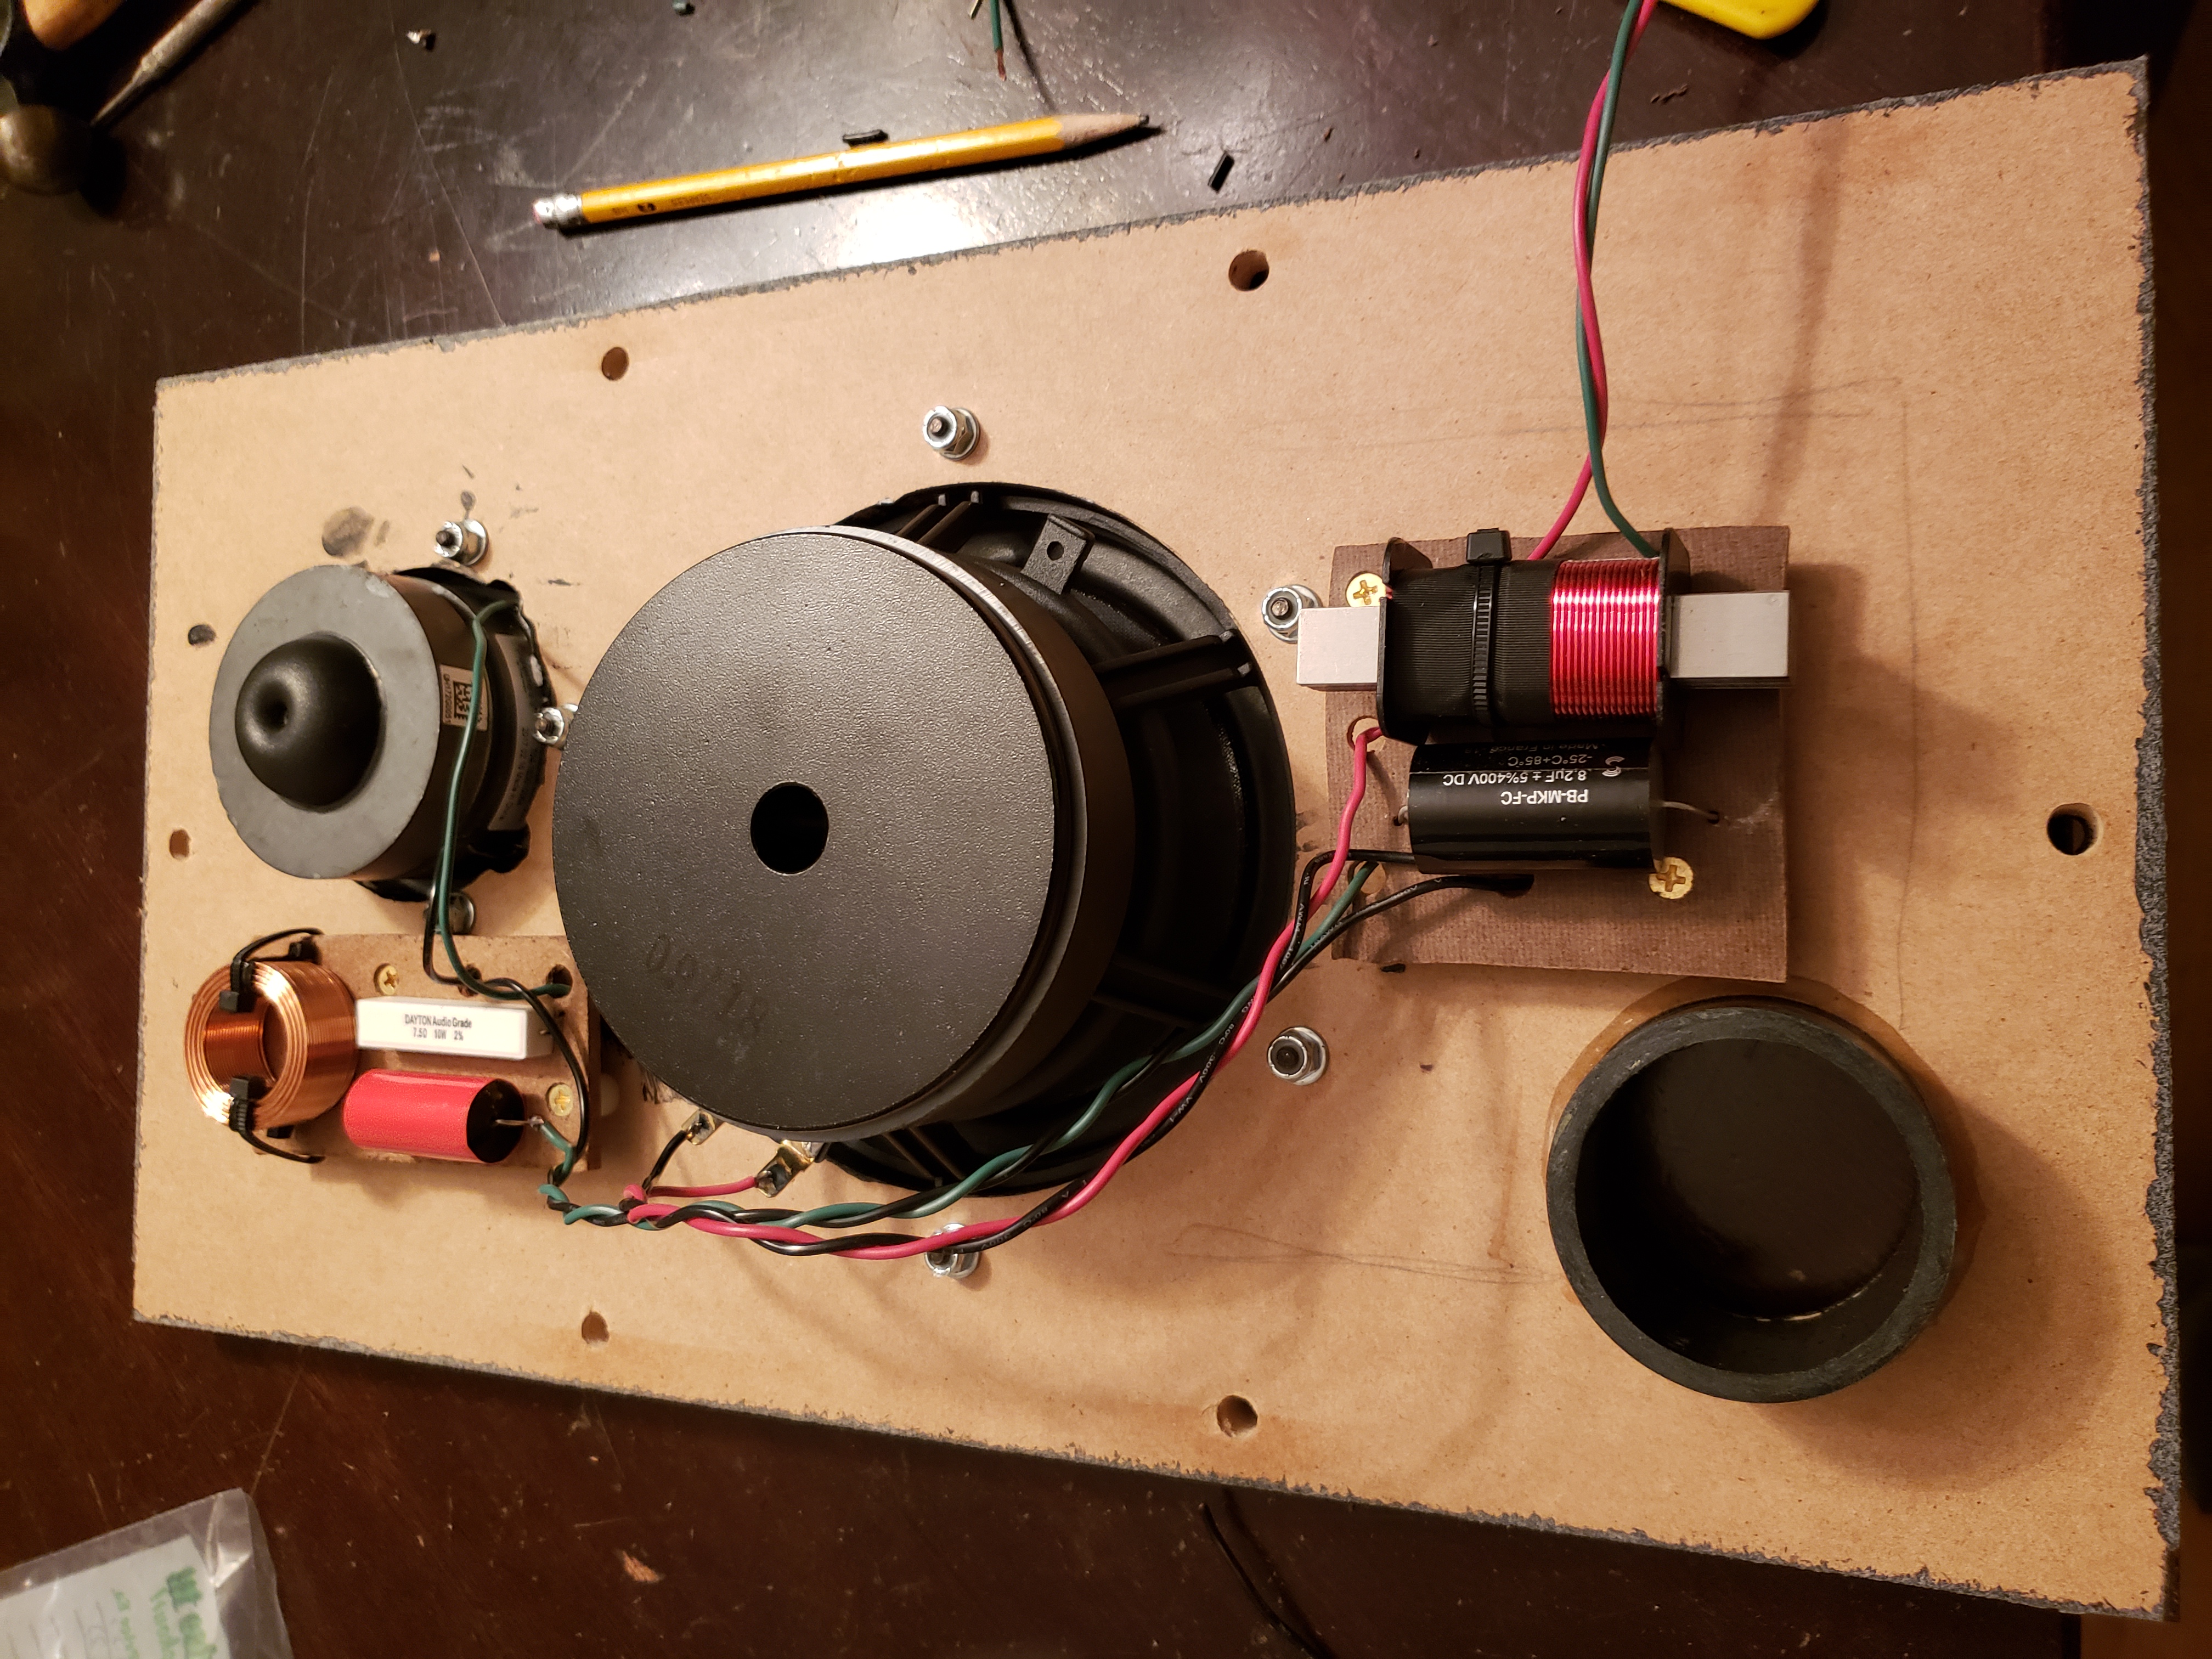
Finished assembly, wired for prototyping. 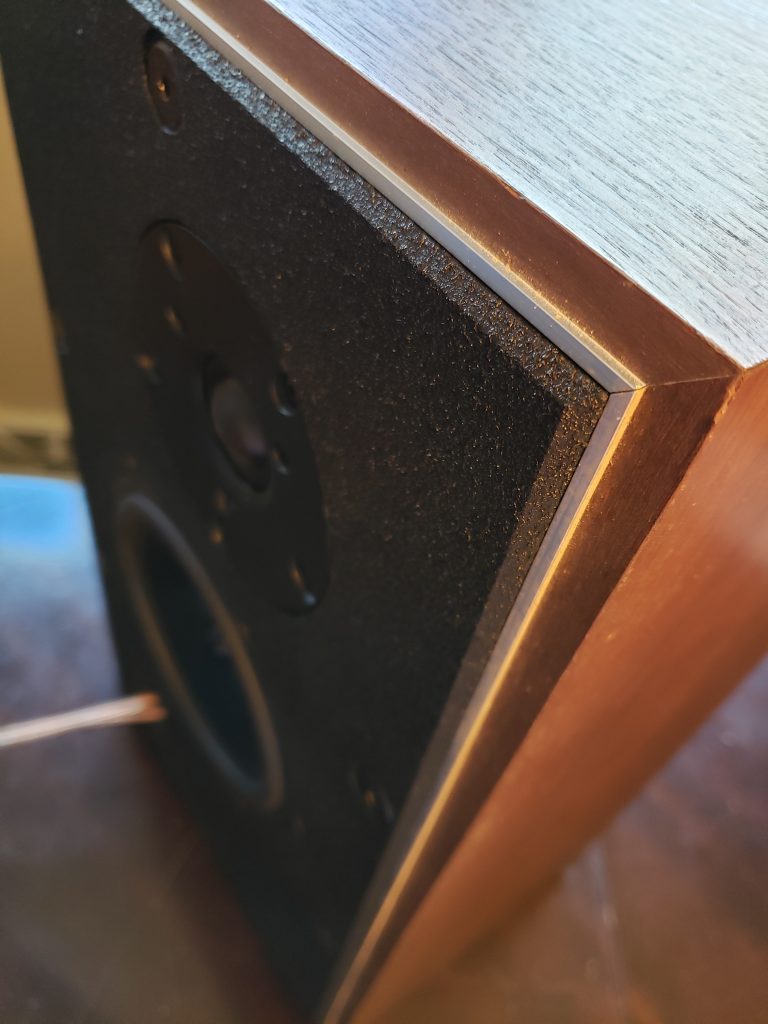
Finished assembly, wired for prototyping. 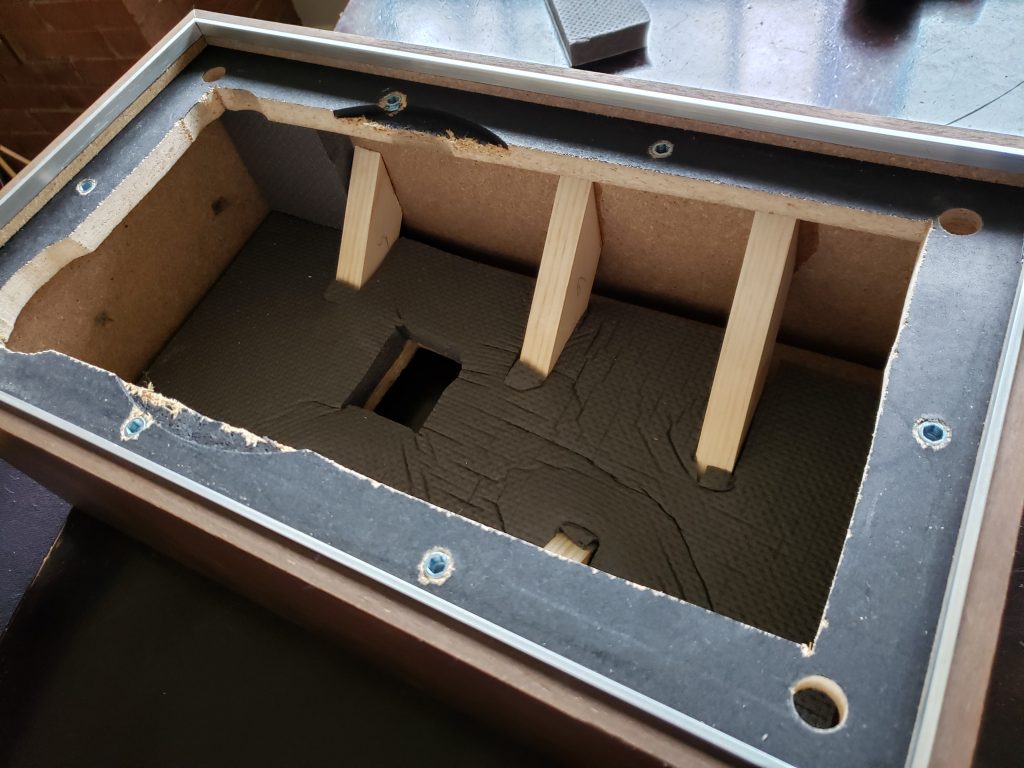
Internal bracing and damping material added. 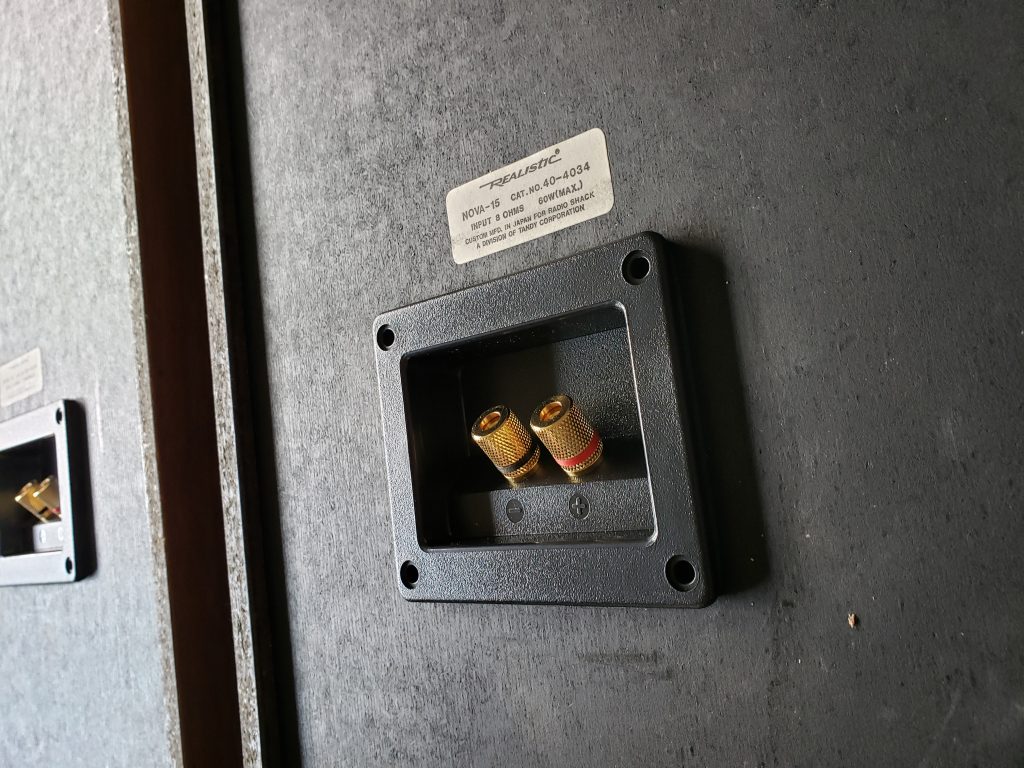
Upgraded terminals.
After proving the crossover in prototype, the parts were laid out on 2 individual boards and mounted to the removable baffles.
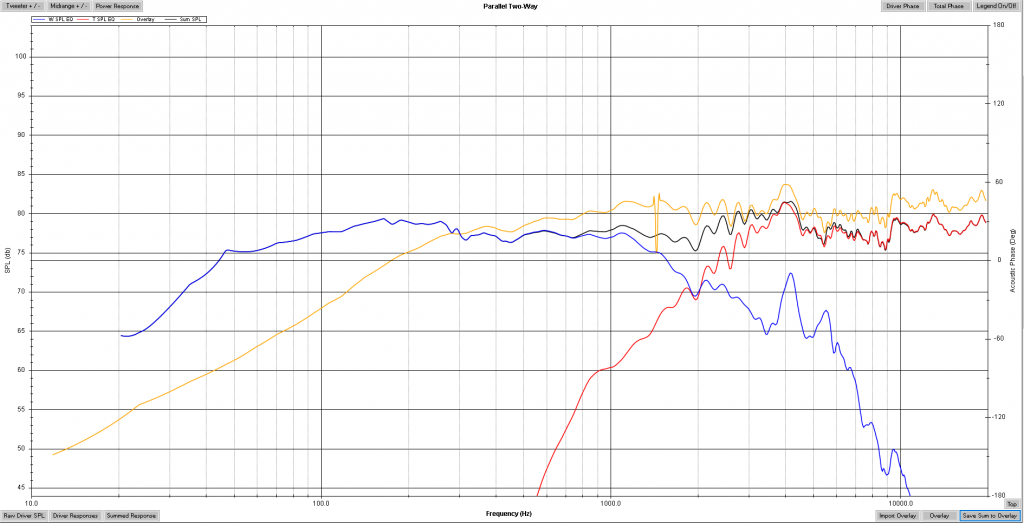
The final system was verified with a DATS impedance measurement and an updated mic measurement, blended with close mic measurements of the woofer and port under 300Hz.
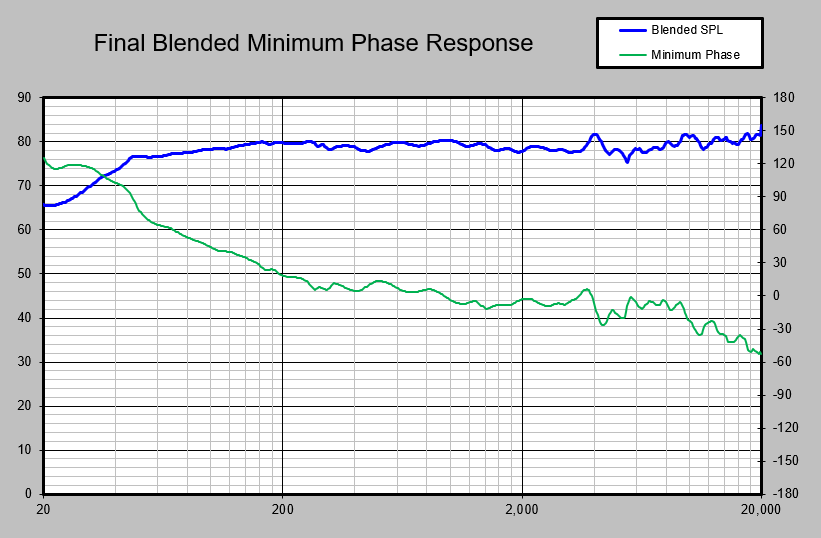
The final frequency response is +-3dB from 40 to 20kHz. The bass alignment is similar to an extended bass shelf, where the 40-60Hz response is toward the bottom of the response tolerance.
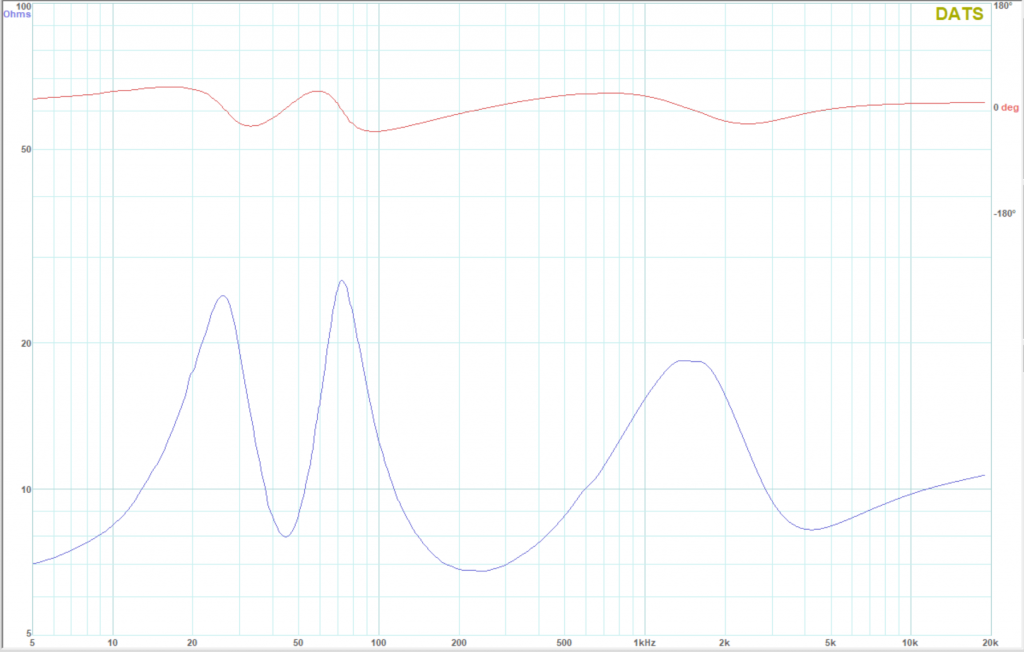
The system impedance is an easy 8 ohm load for any amplifier.
Fun with Hand Tools
Botched port, router got away! 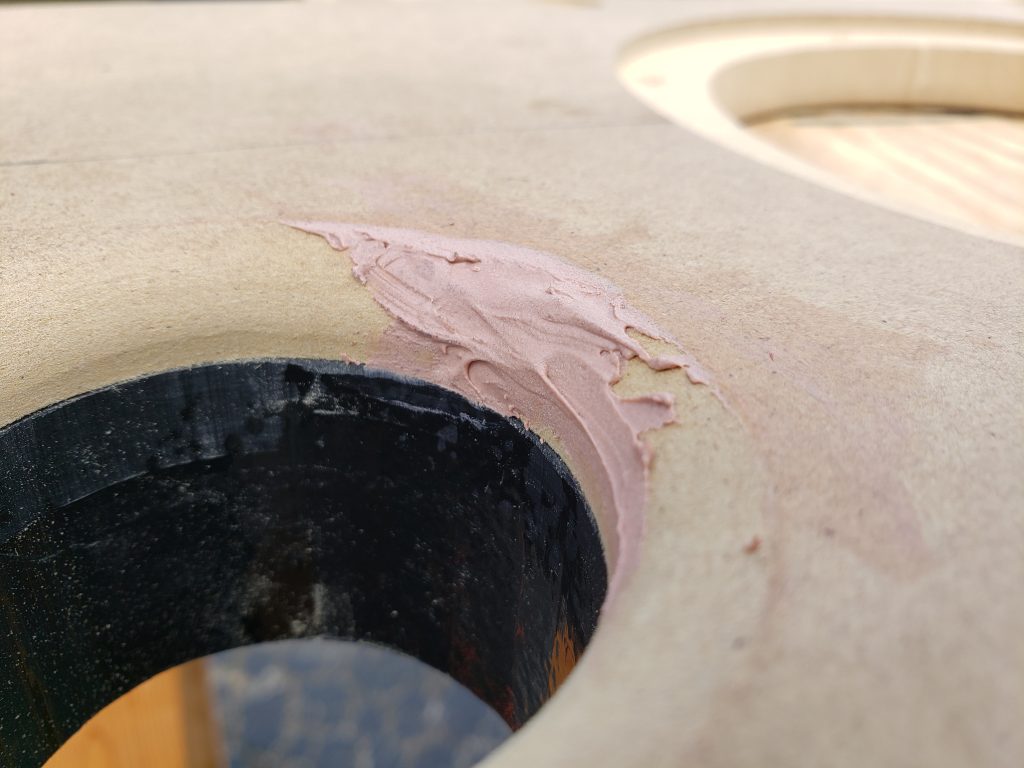
Port mistake bondo’d and ready to smooth. 
Port mistake, rounded back over and sanded
Boo boo number one came when flush trimming with the router. I opted to not glue in the port tube slugs to the back of the baffle before tackling the flush trim and round over. My port tube slipped at the end of the sweep, causing a dig into the baffle with the router that ended up having to be fixed with Bondo and a re-route.
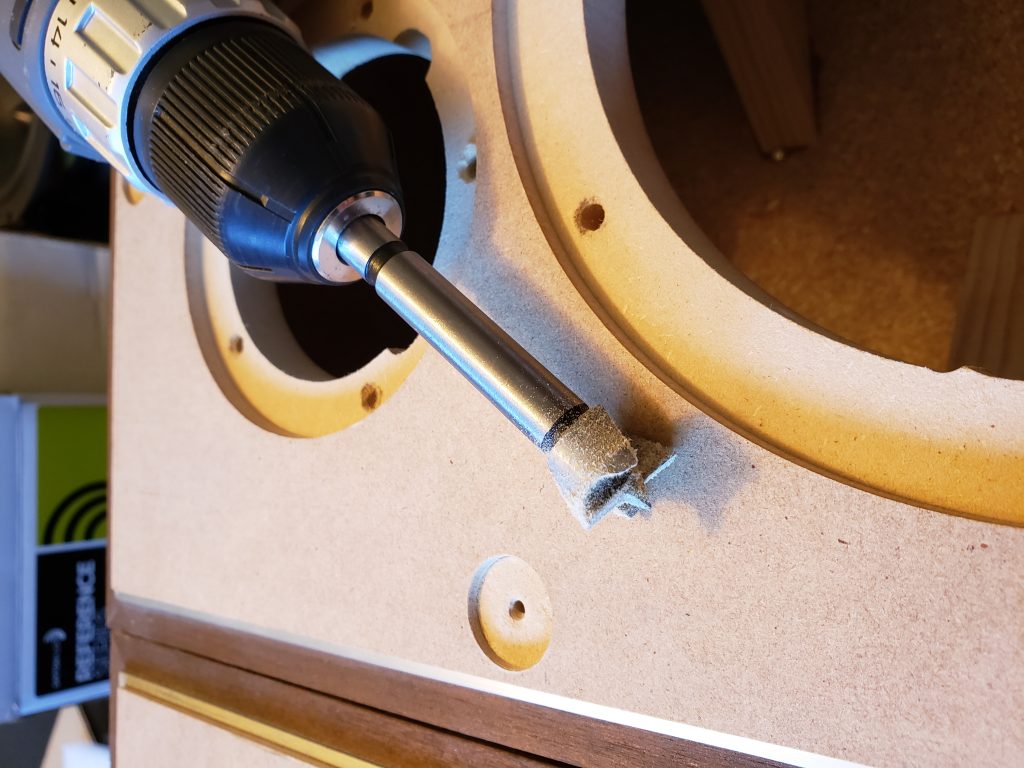
Carefully using the forstner bit to sink the hardware. Good example of centered mount hardware. 
Tolerance issues with hand drills.
The other fun part was executing all the holes with a hand held drill. This led to some tolerance issues on some mounting points, but nothing too bad.
So, how do they sound?
Ultimately these are extremely detailed and enjoyable to listen to. The final product is flat within +-3dB from 40Hz to 20kHz with well under 1% distortion from 100 to 20kHZ, often near 0.1%.
The final design is subjectively slightly soft in the bass, and benefit from placements within 2 feet from a wall or corner. The midrange and treble are strong, accurate and low distortion. This gives excellent imaging and detail and would be well suited for use as a studio monitor where critical views of listening material are required.
Parts used
The parts for these were all sourced from Part-Express.
| Part | Description | Model | Cost | Qty |
| Woofer | 7″ Reference Series | RS180P-8 | $ 51.75 | 2 |
| Tweeter | Peerless DX25BG60 | DX25BG60-4 | $ 34.35 | 2 |
| Woofer | ||||
| L1 | Dayton 1.5mH Solid Core | IC181-5 | $ 4.18 | 2 |
| C1 | Solon 8.2uF | 027-564 | $ 7.00 | 2 |
| Tweeter | ||||
| C1 | Audyn 4.7uF | 027-114 | $ 2.80 | 2 |
| L1 | Dayton 0.6mH Air Core | AC20-60 | $ 4.48 | 2 |
| Rs1 | Dayton 7.5 Ohm | DNR-7.5 | $ 1.38 | 2 |
All Build Images
Series vs. Parallel crossover types, initial measurements. 
Tweeter impedance, no protection 
Tweeter impedance with a protection cap for a 200Hz high pass. 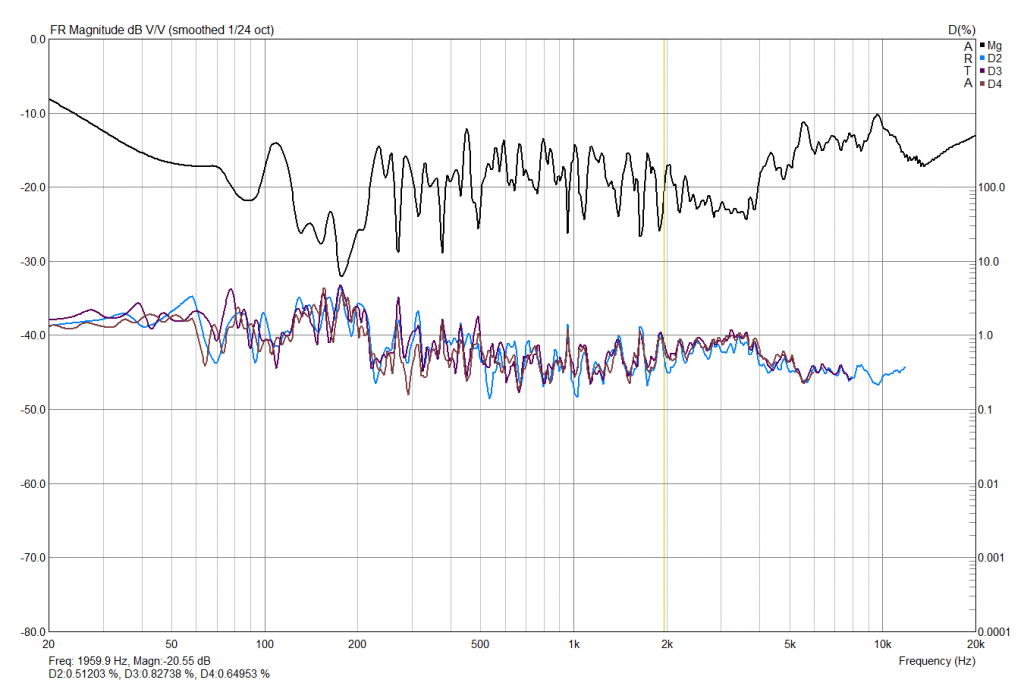
Distortion sweep, woofer only. 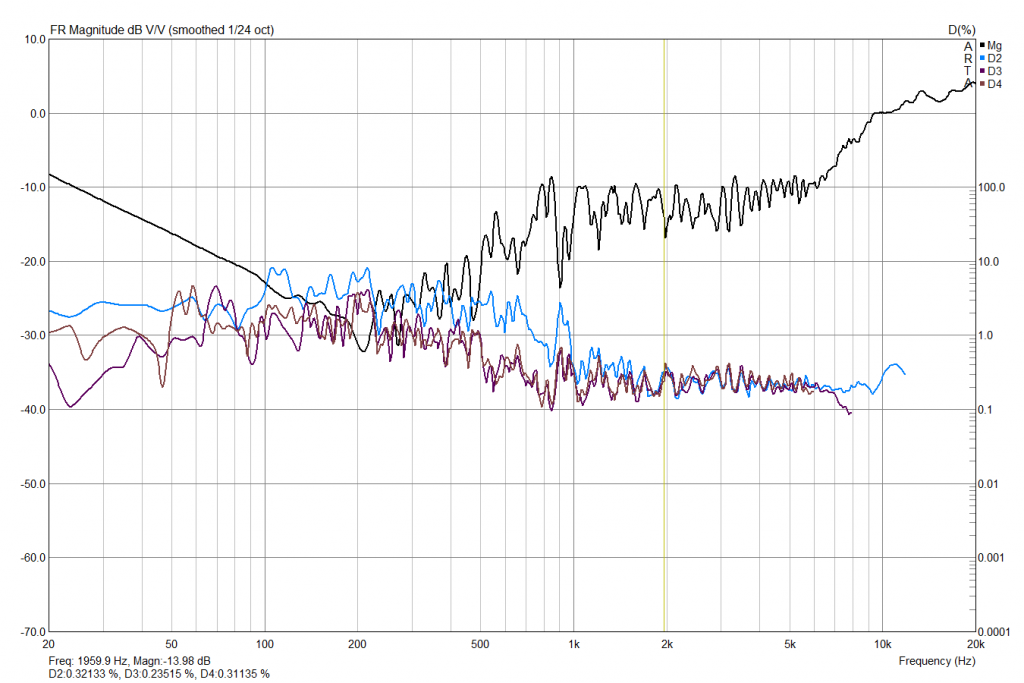
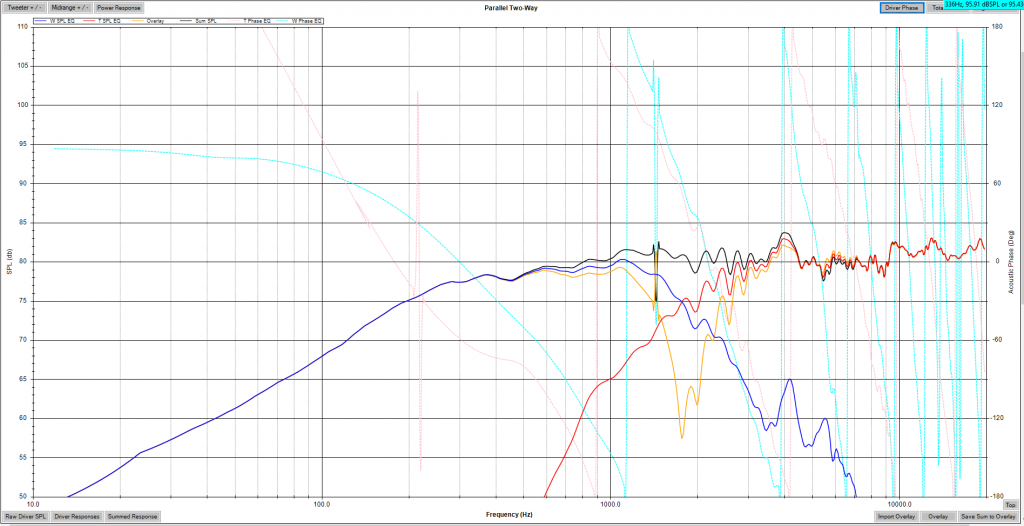
Distortion sweep, tweeter only, EQ accidentally applied. Parallel crossover re-design for full baffle step. 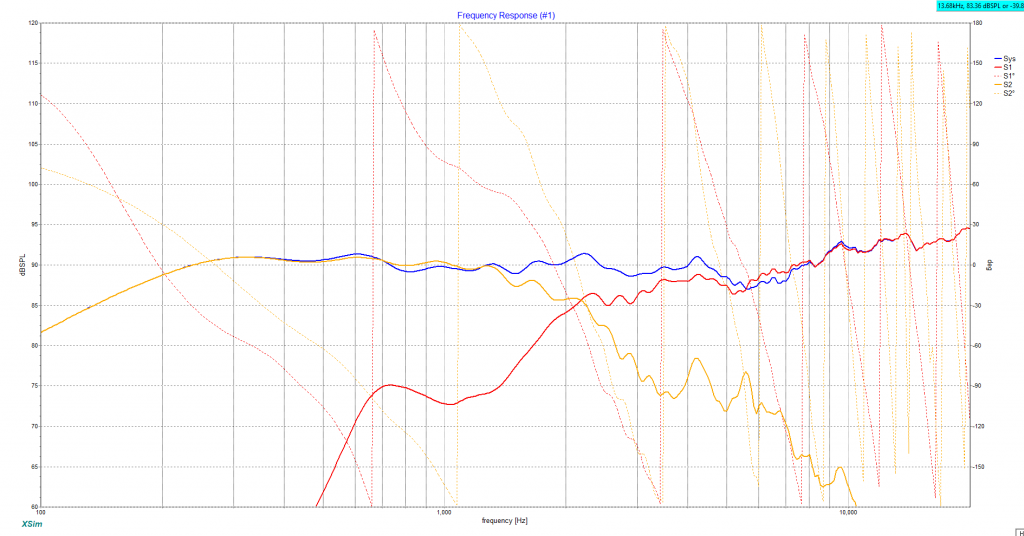
Series crossover example with driver phases, initial measurements. 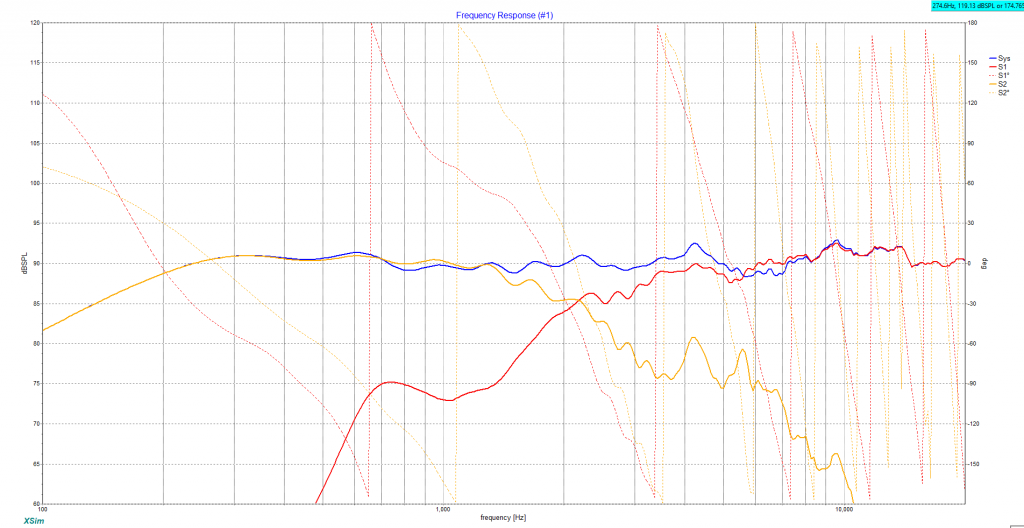
Series crossover example with additional inductor for tweeter, initial measurements. Box simulation for the RS180P-8 in the Nova 15 cabinet. 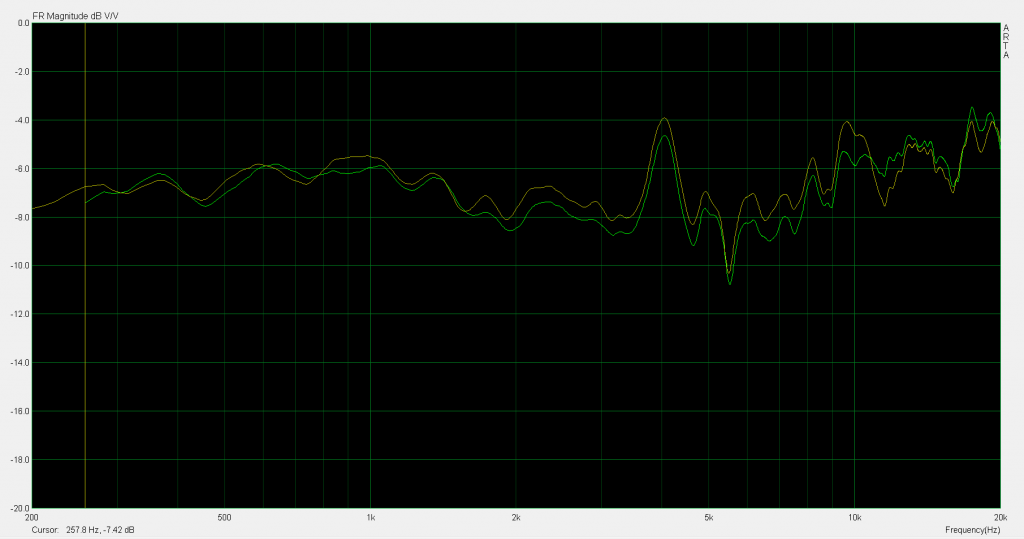
Final system detailed comparison between R and L channels. 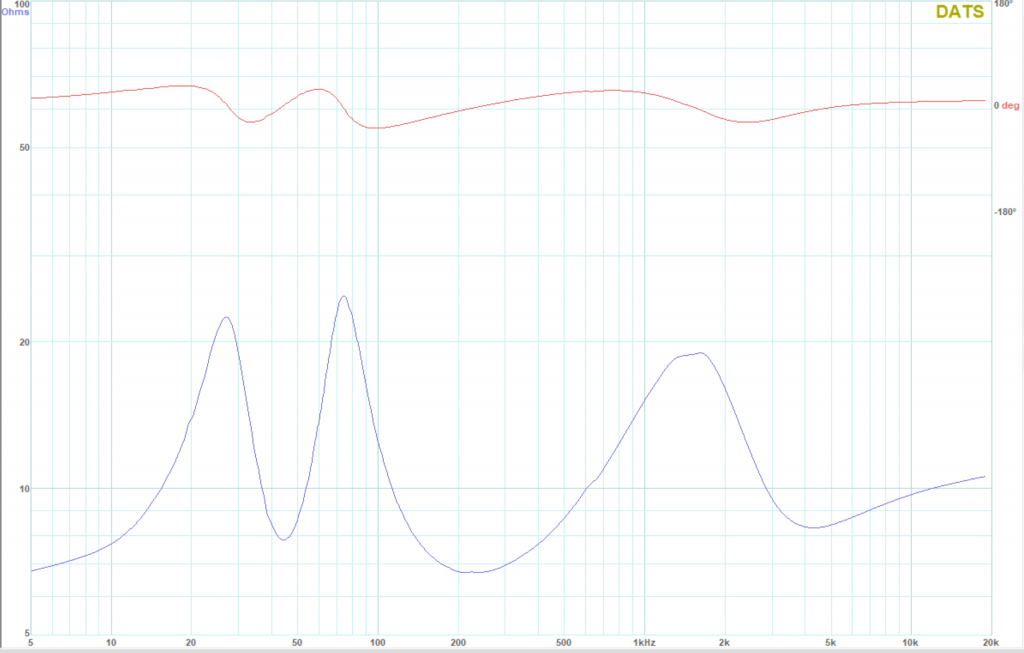
Full system impedance, R speaker 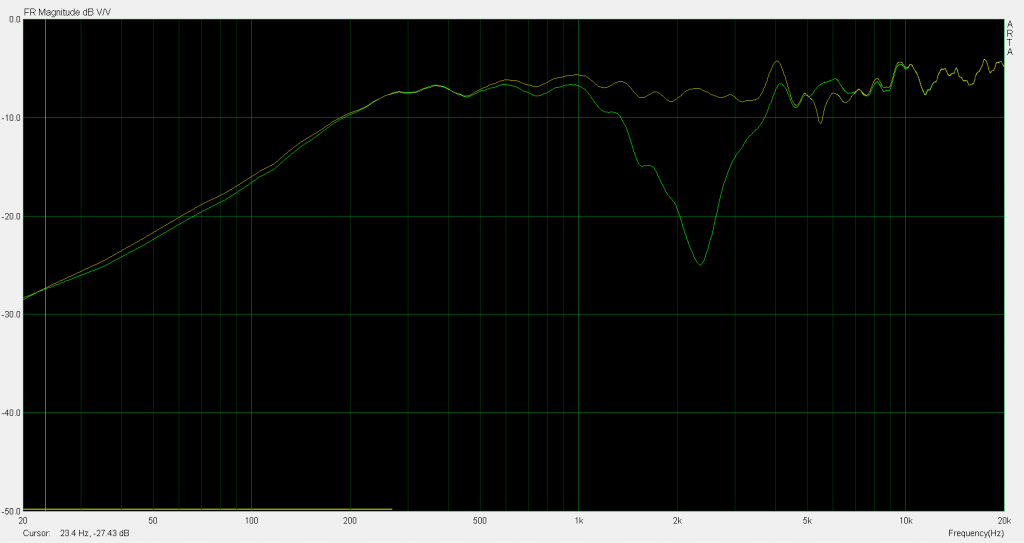
Full system gated comparison with reverse null, R speaker. PCD Sum aligned with measured response overlay, indicating the Z offset was located. PCD system sum without Z offset set, showing mismatch between measured. 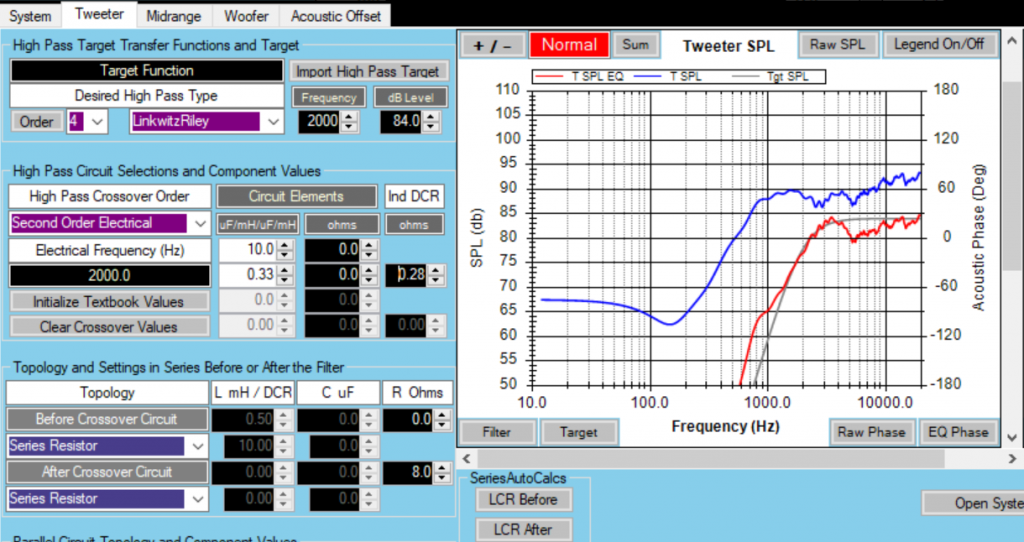
LR4 Tweeter crossover target. 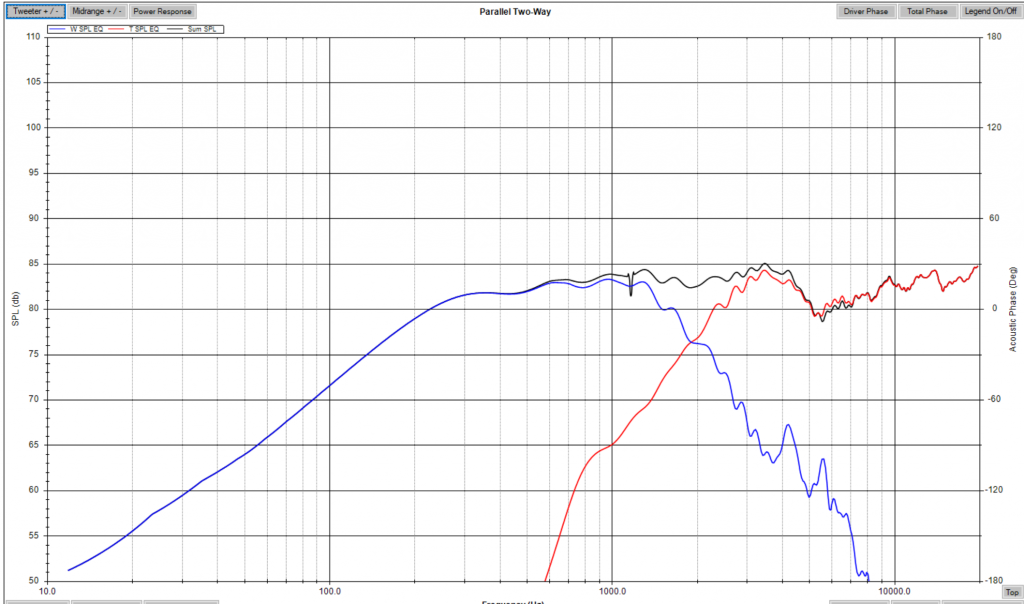
Parallel test #1, initial measurements. Parallel example, with updated measurements. (baffle step too low) L Woofer tuning in cabinet 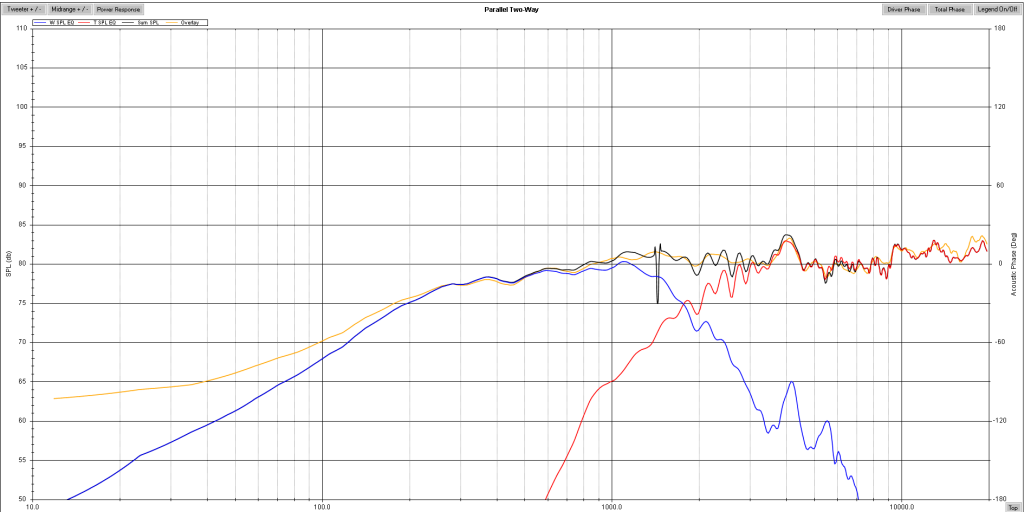
Parallel system sim compared against actual measured response. Final system impedance, L speaker L woofer close mic and port measurement sum. L speaker reverse null, initial parallel test with too little baffle step. L system distortion 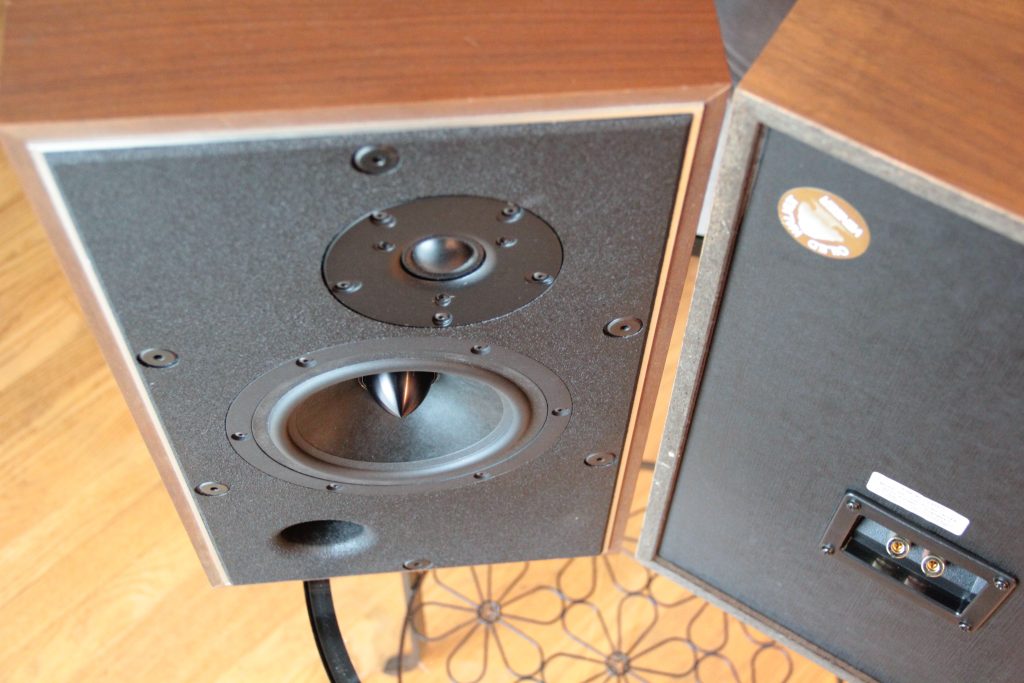
Finished speakers, Oiled Walnut Veneer sticker 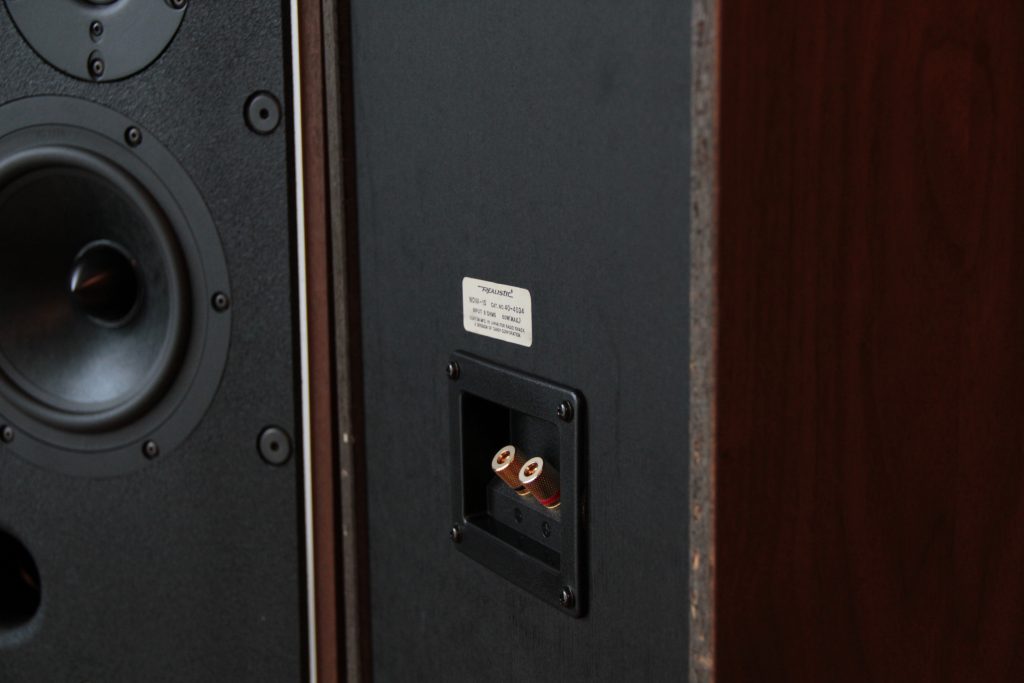
Original Realistic part sticker. 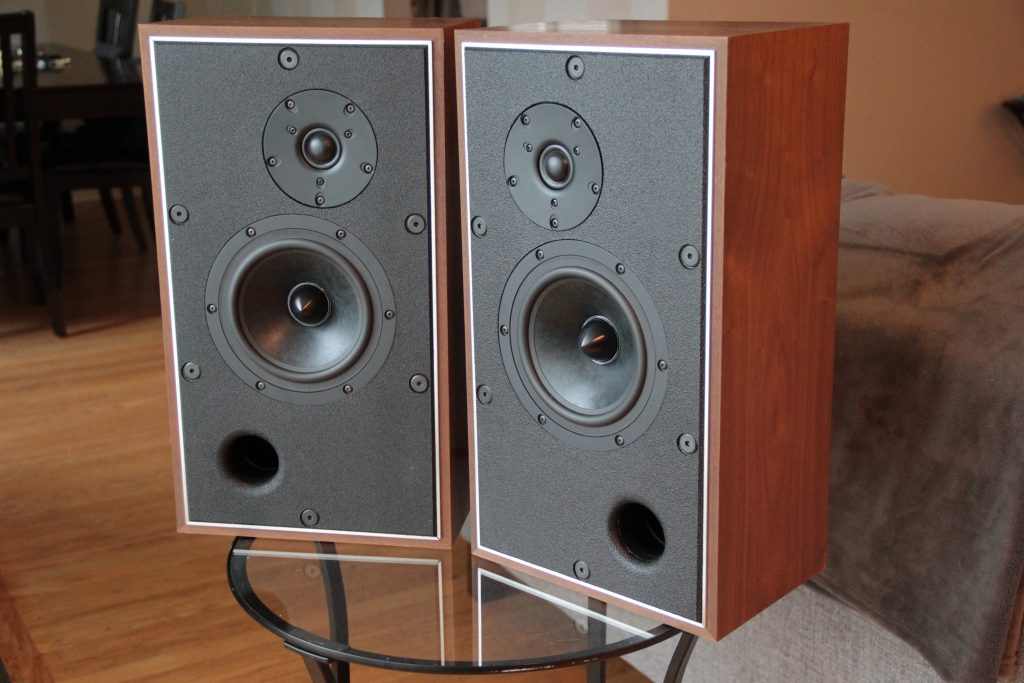
Completed SuperNova Minimus Final system response with blended close mic measurements below 300Hz. 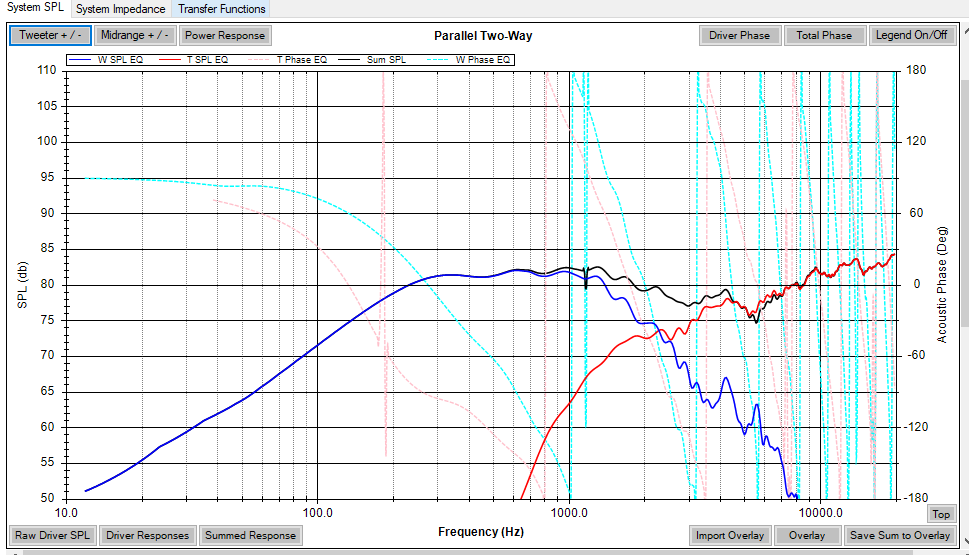
Parallel crossover test 1. Final crossover schematic 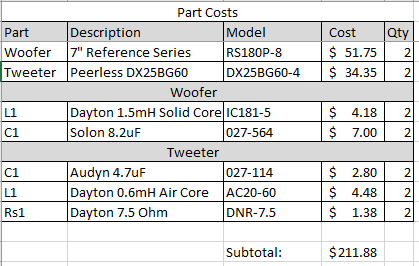
Final BOM and cost ARTA sweep measurement settings. ARTA frequency compensation settings. 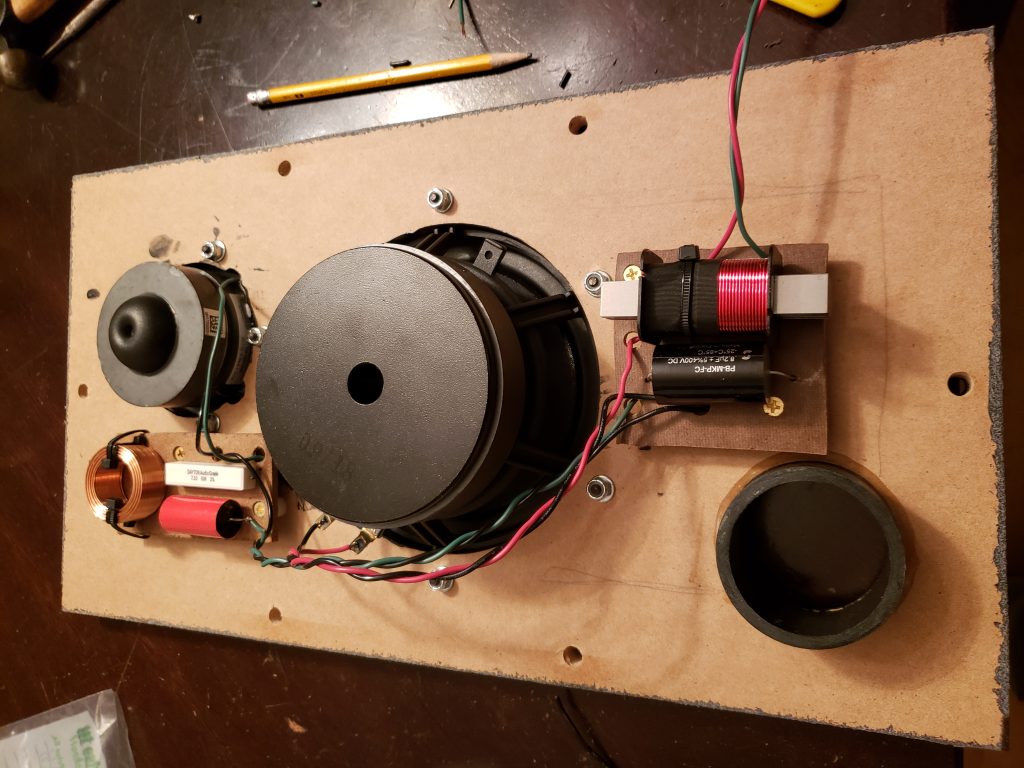
Crossover board layout and mounting. Finished assembly, wired for prototyping. Finished assembly, wired for prototyping. Internal bracing and damping material added. Duratex in process on the baffles. Port mistake, rounded back over and sanded Upgraded terminals. Port mistake bondo’d and ready to smooth. 
Close up chamfer. Baffle installed and ready to measure. 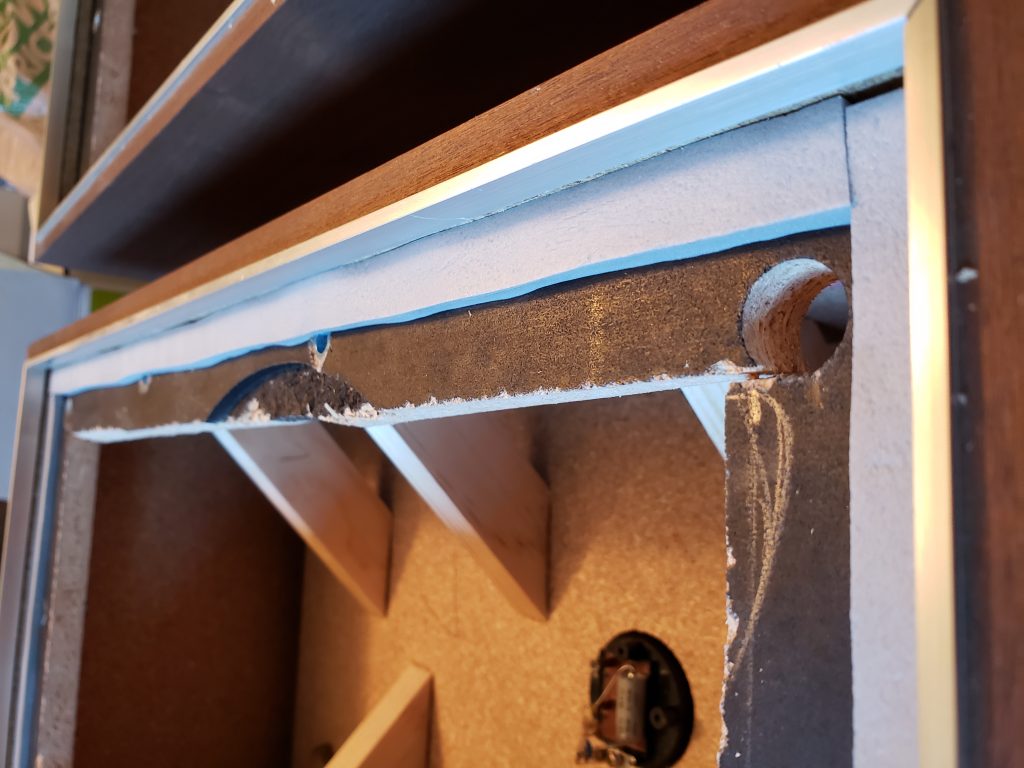
Weatherstripping for baffle seal. 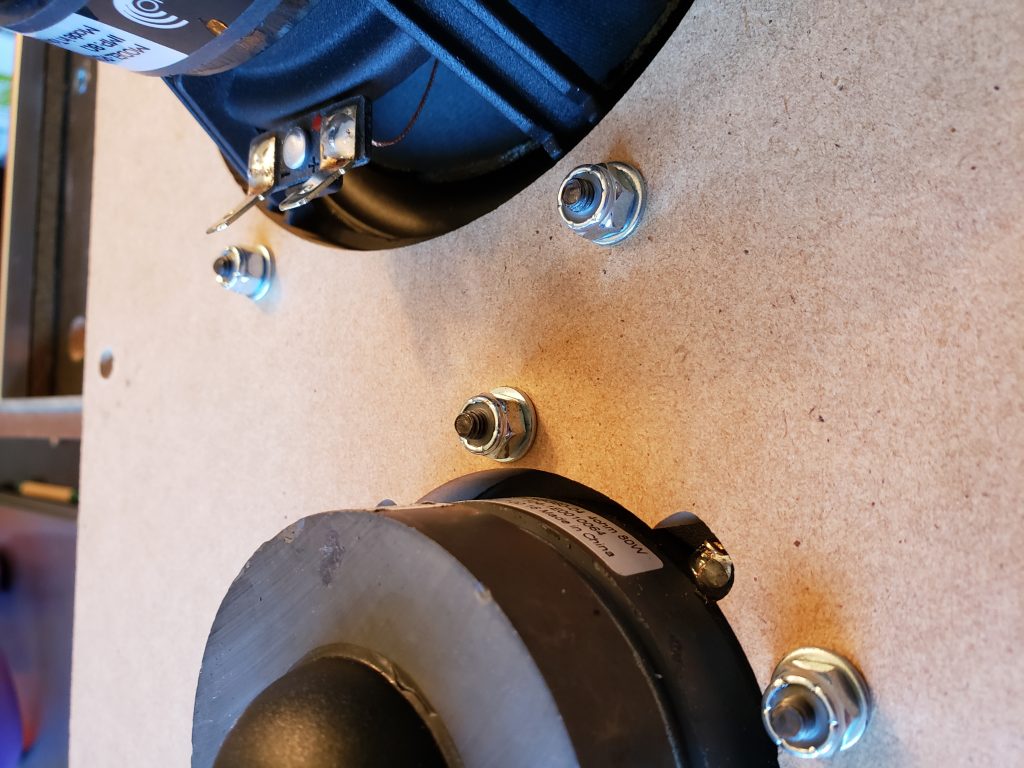
#8-32 hardware installed on rear. Tolerance issues with hand drills. 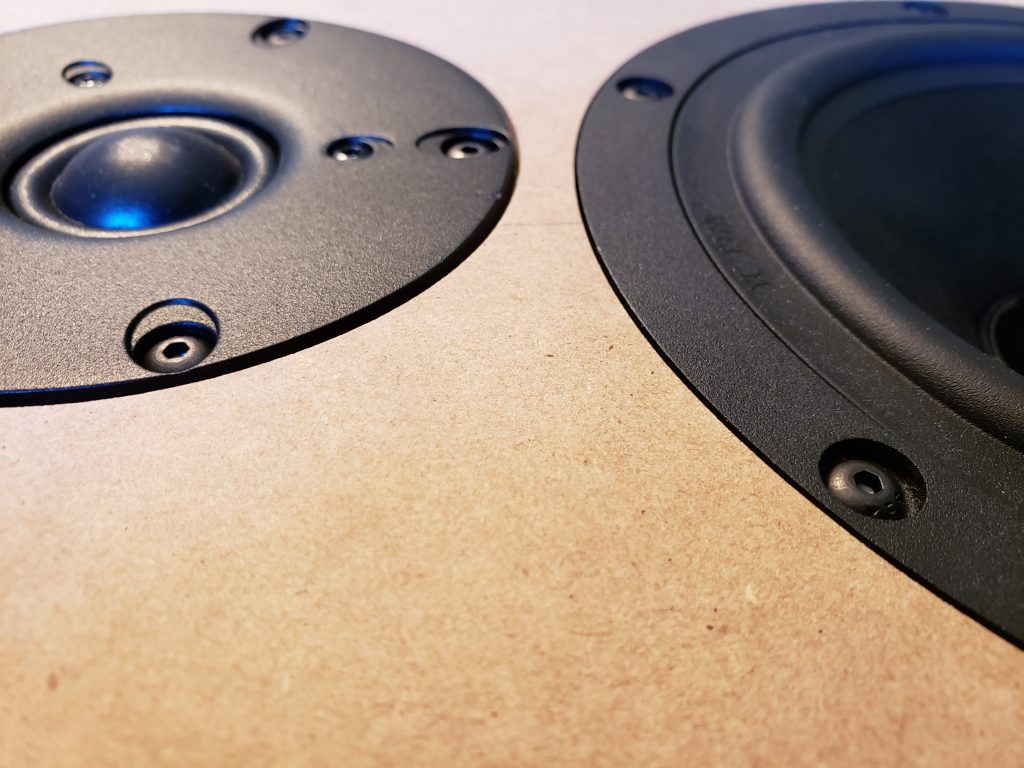
Flush mount test Good example of centered mount hardware. 1/4×20 insert nuts installed. Carefully using the forstner bit to sink the hardware. Port elbow clearance 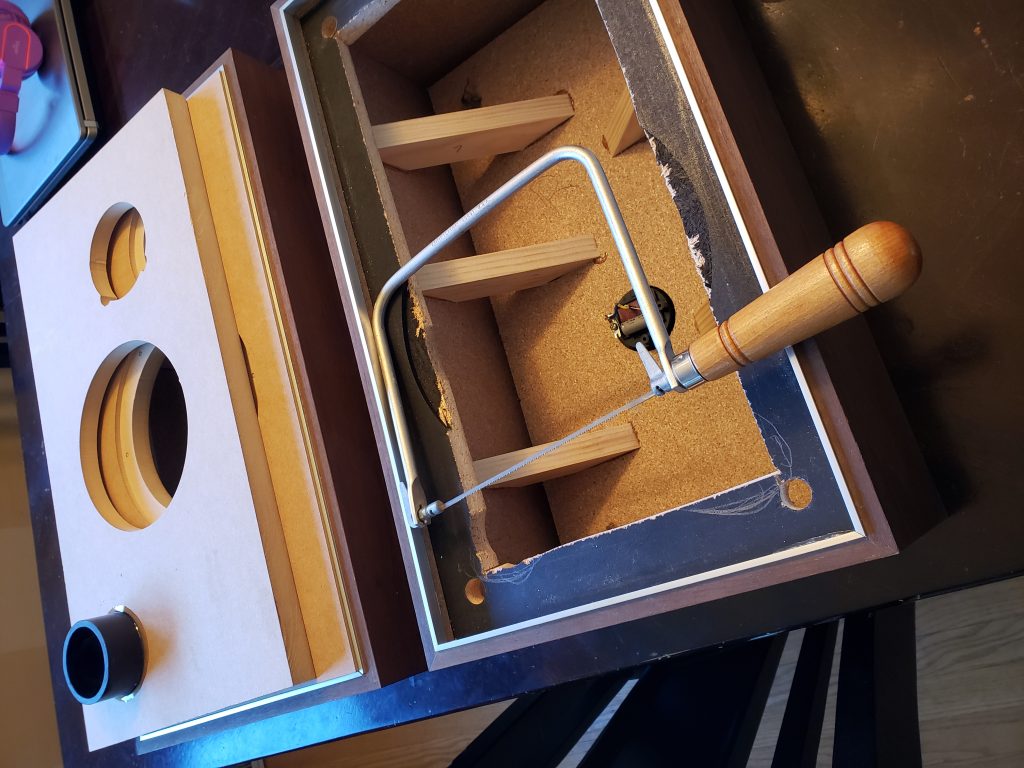
Scroll saw for carving out clearance for the ports. Symmetric bracing plan. Cabinet bracing Braces ready for installation. 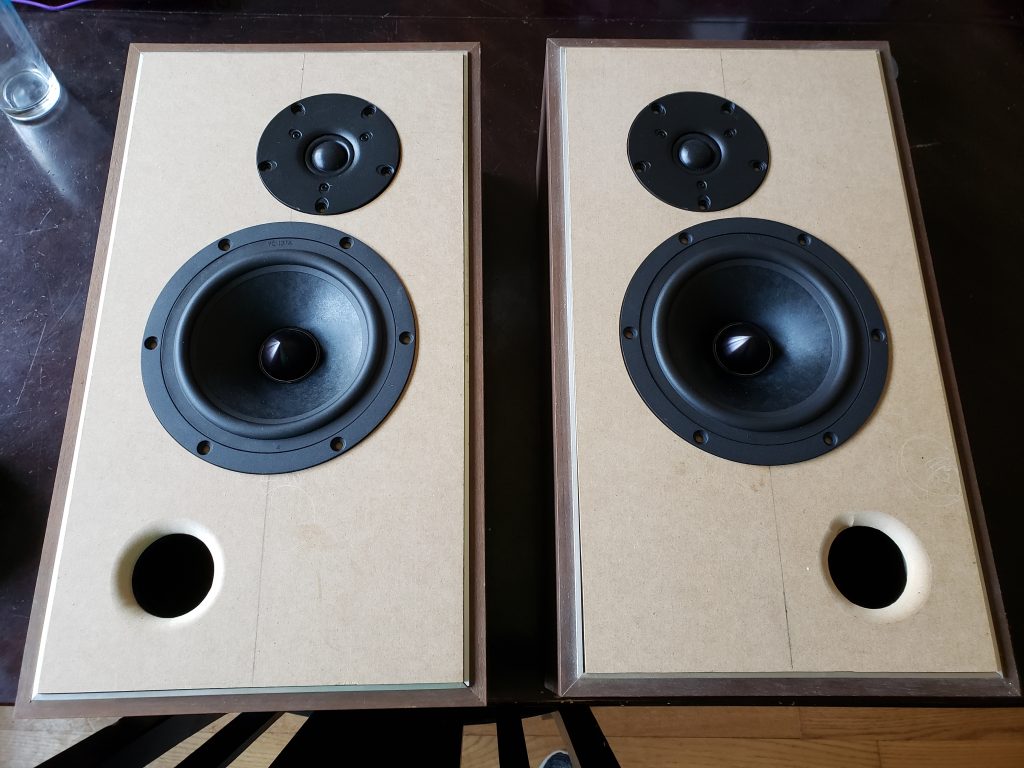
Matching mirror image baffle fit test. Woofer and Tweeter routed. Botched port, router got away! Woofer and tweeter fit test. Perfect port. Blank baffle fit test Straight bit trimmed port, ready to round. Original baffles removed. Port tube installed in rear of baffle. Original baffles, hardware removed. 1/4″ route for port tube. RS180P-8 vs. Realistic original woofer RS180P-8 vs. Realistic Original Peerless tweeter vs. Realistic original Realistic originals Realistic original grill