Advanced Speaker Design Simulation
Before you start making sawdust in the shop, there are a whole host of tools available to the DIY speaker enthusiast that can help you estimate and design your speaker on your computer. For engineering nerds like myself, this can be a big part of the fun of speaker building. To date the information on home speaker design I’ve posted have focused on subwoofers, which while exceptionally fun, are really pretty simple to model and build. Here we’ll shift focus to the rest, and majority, of the audible spectrum and deal with the trickiest part of a full range speaker design, the ability to integrate woofers, midranges, and tweeters into a cohesive and accurate full range design.
We’ll go through some of the more common available tools, and run through a scenarios I’ve used to design a theoretical speaker to be built.
The generally accepted goal in speaker design is to reach as close to the ideal as possible, where the speaker produces any frequency audible to humans with the same loudness, phase, and time alignment. This is completely impossible in reality, so there will always be some sort of compromise involved. The goal of this tutorial is to use the tools available to balance those compromises as best we can and make a decent speaker.
This article isn’t going to get into the details of passive filter theory, and instead assumes you know a little about stuff like filter order and roll off types. It’s also assuming you could identify inductors, capacitors, and resistors on a schematic and in real life and be able to understand their values. While you don’t need an electronics degree to do this, some basic electronics is really, really helpful. If you don’t know an ohm from a farad you may want to step back a minute and do some additional learning before continuing.
Online Communities
First, there are several communities that can help you with this process and provide a plethora of information on how to do this. In many cases, the developers of the software we’ll be using are actually active members of these communities.
Jump in and join the community to get started, many of these folks are far more experienced in both design and actual build / implementation of all kinds of speakers than myself.
Software to Use
There are a ton of tools out there, so I’ll focus on the one’s I’ve learned and know work on my computers. These are all up and running on Windows 10 64 bit, and several of them require Microsoft Office installed. Generally, the Excel based tools require 2007, work fine on 2010, and in my case are working under Office 2013 Pro Plus with just a couple odd error messages that appear to not break the program. In all cases, your Office installation will have to be the 32 bit versions. We’ll address the why and how for using these programs a little later.
SPL Copy
This program is used to generate useable FRD and ZMA files from the graphs you can find on manufacturer specification sheets. Also, this program has no documentation I could find online, but there’s a number of discussion threads on the DIY Community sites. The original source of the file has been taken down, so I’m hosting the application here but can offer no updates or support beyond the use description provided here.
Response modeler
This is an Excel based application that can integrate baffle interactions and step response into FRD and ZMA files. It also includes enclosure low frequency response, and the ability to convert and output minimum phase files. This one is built by Jeff Bagby, who has a collection of other handy Excel based tools available here.
WinPCD
This is a Windows application version of Jeff Bagby’s Excel based Passive Crossover Designer. The Windows version is quicker than the Excel version and plays nicely under Windows 10. The advantage of this program is being able to use textbook calculations for crossovers as your starting point, as well as advanced tools that implement acoustic offset and system dispersion characteristics.
XSim
This is a flexible crossover designer and allows you to draw your own schematic for limitless circuit arrangements. The downside is that it lacks the dispersion and acoustic offset calculations. Also, if you’re unfamiliar with typical crossover topologies, you’ll have no place to start. I found this program particularly useful after using WinPCD to draw the final schematic and validate the connections. There’s no documentation on this one, but a discussion thread straight from the developer can get you started.
FRD and ZMA
First, before getting anywhere, you’ll need these files to begin your design. These are simple text files that define a speaker’s frequency response, phase, and impedance across the audio frequency band. There are a few ways to get these:
Actually measuring your speakers – of course this requires actually having the speakers, having the measurement gear required, a test baffle or the target cabinets, and a room to measure them. The result will be spot on with reality, but few have the time and money to invest in this capability.
Manufacturer files – some speaker manufacturers provide you these files on their site. For example, the Dayton Audio brand speakers on Parts Express have a documentation packet including the FRD and ZMA files. While there are manufacturing tolerances involved, the data is generally pretty close and good for selecting your speakers and starting your design.
Graph tracing – If you can’t get a pre-built set of files, but you have a decent graph of the response and impedance provided, you can use SPL Copy to trace and save the graphs as FRD and ZMA files
Using SPLCopy
 Once you have SPLCopy running, and your manufacture graph ready to go, I found it easy to use the Windows Snipping Tool to grab the graph and pull it into SPLCopy. You’ll want to get the graph on your screen as large as you can, then snip it with the snipping tool and hit the copy button, then simply select
 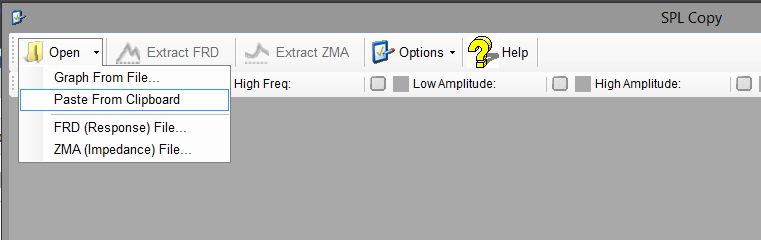 Open – Paste From Clipboard to pull it into the program. Make sure you can see the whole graph, and simply change your zoom settings and try again until it looks right. The larger you can make it on your screen, the more accurate you’ll be.
Next, you have to tell the program where the boundaries are. Click across the top and set the low and high limits for frequency, amplitude and impedance using the labels on the chart. Note that in my example, the impedance in particular is hard to estimate since the scale is different and they didn’t provide a label above the impedance peak. Do the best you can.
 Once all the boundaries are set, the Extract FRD and ZMA buttons will be available. Click FRD, and the program will prompt you to identify the start of the SPL line. The magnifier will show you exactly where you’re clicking, and it is very important that you click the exact color of the line you want to trace. Once you click, the program will attempt to follow the line and prompt you to help it when it can’t figure it out. Just use the arrow keys to help it along to the next point and it will move along. When it’s done, it will show you the result of the trace. Click save and you’ll have your file. Repeat the process for the impedance.
Once you have these files, you can start your design. You can open them with Notepad to take a peek at the format, and eliminate some potential errors that can occur. An FRD file should be a simple list of numbers, the frequency, amplitude, and phase listed as columns with rows for each frequency included. If there are any headers, or additional notes at the top, delete them or you’ll have errors when importing the data. That applies to both FRD and ZMA files.
Response Modeling
The next step is to bring those raw FRD and ZMA files into a program to add the interaction of the intended speaker cabinet. There are a few things that will be added to the response data at this point.
- Baffle step response – As the wavelength of the sound exceeds the dimensions of the board the speaker is mounted to, the radiation pattern changes from half space to whole space and you get a 6dB drop in response.
- Baffle edge diffraction – As the sound radiates off the edge of the cabinet baffle, small interferences will occur changing the frequency response and adding little ripples in the chart
- Woofer enclosure – The addition of the cabinet type and tuning will be applied here as well to give you a better picture of the low frequency extension
In order to capture this you have to know the dimensions of your speaker and where the driver is placed. For woofers, you’ll also need to know the T/S parameters plus the volume and tuning of the box.
You’ll be executing this step for each driver in your box individually.
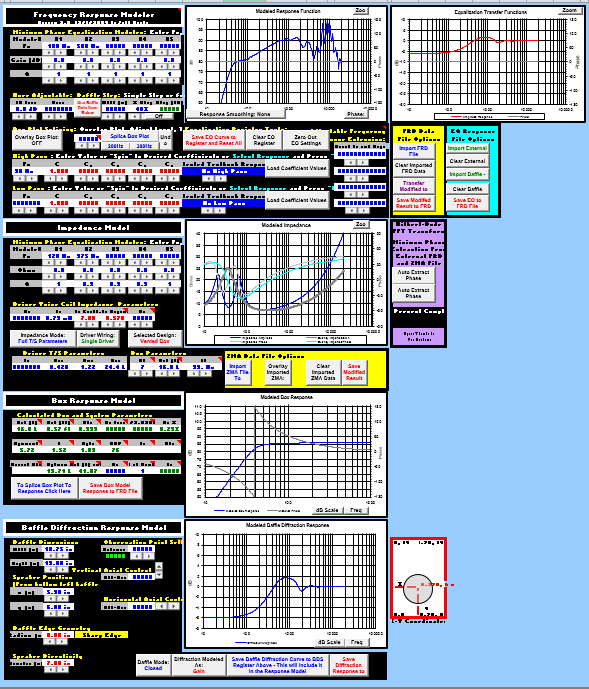 When you open the Response Modeler Excel file, you’ll have to bypass some Excel macro restrictions. Allow macros to run, and set the document to a trusted file if prompted to ensure everything runs correctly. Don’t get overwhelmed by the screen, there’s a whole lot going on!
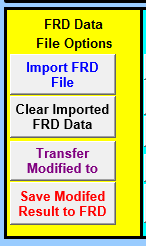 First, you’ll need to import your source FRD and ZMA files. Use the yellow shaded areas to locate and import your files.
There’s no rule about this, but I tend to start down at the bottom, that’s where you’ll define your baffle dimensions and layout. Important fields:
- Baffle dimensions height and width in inches
- Speaker position X and Y in inches (use the image to see where the origin is)
- Baffle edge geometry, if you’re going to round over or not
- Speaker directivity, add the radiating diameter in inches
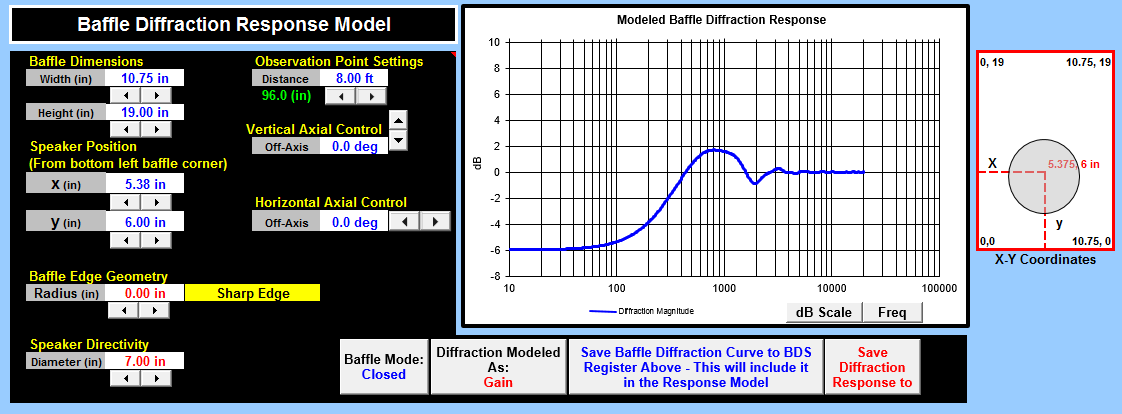 With your dimensions setup, you can see in the graph the result on your frequency response. The low frequencies drop off 6dB where the baffle step loss occurs, and there will be some ripple where the baffle edge interferes. Click “Save diffraction response to…” to begin applying the response to your model.
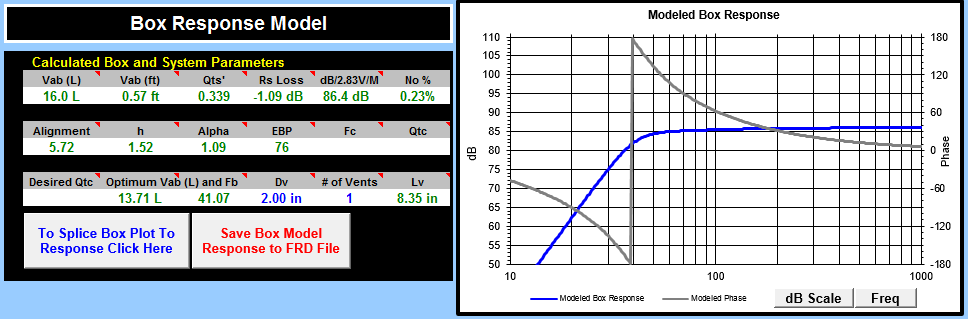 For woofers and open back midranges in a chamber, the next steps will be the box model and the impedance model. First the box model. Generally, I model my bass boxes in Bass Box Pro to get these values because it’s easier to play with, but WinISD (not covered here) will work, and you can always simply enter your intended box. Only the Blue text is editable, so enter your vent diameter and quantity and move along. Leave the rest of the section alone for now, we’ll splice that to the response a little later.
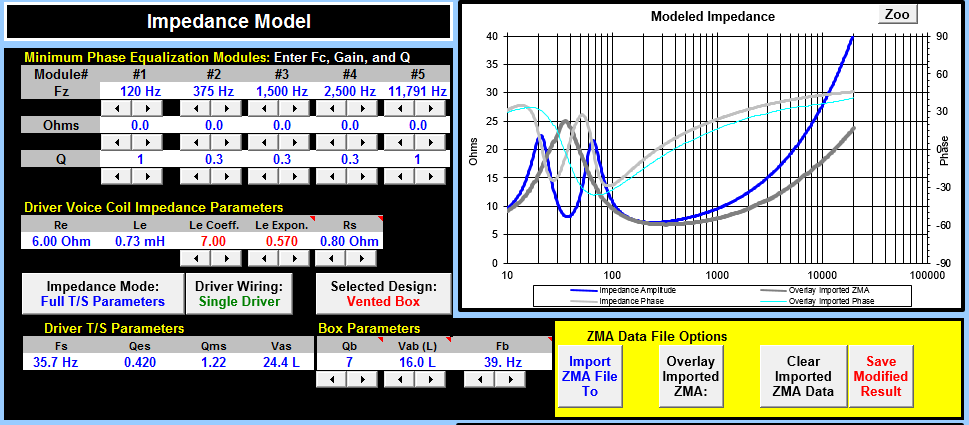 Next the impedance model is important. Enter the additional driver parameters and the box specifications. The specs are used in the box model as well, so enter the internal volume of the box (net in liters), and the tuning frequency of the box. For the Qb value, I’m not sure how to accurately edit that, so I’ve left it at the default typical value of 7.
At this point, your impedance should show the dual hump pattern of a vented enclosure, and you’re ready to export your modeled ZMA file. Back in that yellow ZMA section, click “Save Modified Result” to spit out your file.
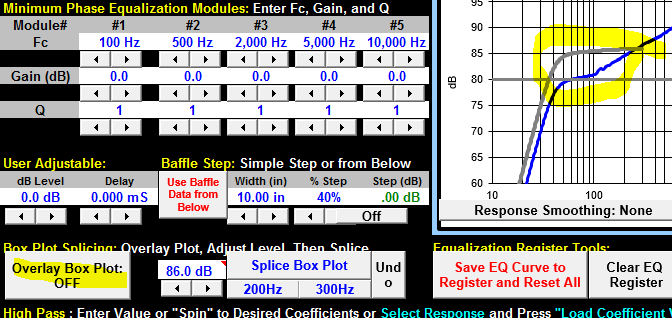 Next, we have to complete the FRD file. The final piece here is adding your box response. Click the button “Overlay Box Plot” to add a grey line to the chart indicating the effect of your box. You may need to move it up or down to meet up with the graph using the level adjustment field. Once that’s set, click “Splice Box Plot” to add it to your graph. I use the “300Hz” button below that to execute the splice. If you miss the level match, you’ll end up with a weird step in the response where the splice kicked in. Just clear the data with the “Undo” button and try again.
When you’re satisfied with all your edits, click the “Save Modified Result to FRD” button back in the yellow section to spit out your file.
Note that for sealed back midranges and tweeters, the box has no effect on the impedance and isn’t needed to splice into the response beyond the diffraction step, so you can use the original ZMA file and move right along to the minimum phase portion.
Another note, my screenshots are from Excel 2013 under Windows 8.1, so you may have some slight differences based on your OS and Office versions.
Minimum Phase Extraction
For this very important step, I’m not even going to pretend I know what’s going on. In spite of my electronics degree, mathematical transforms are generally beyond me. My basic understanding is that it scales the FRD and ZMA files so their phase information lands at a common reference point, which allows the data to be added accurately. Without this step, you can’t accurately proceed to modeling your crossover.
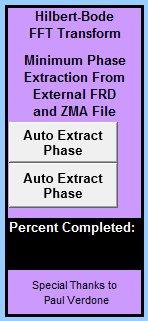 Lucky for you, Response Modeler has this capability built in. Simply click the “Auto Extract Phase…” buttons to run. The program will prompt you for your modeled FRT or ZMA file, then run for a minute, then prompt you for where to save the result.
My recommendation is to keep all of these file separate, the original unmodified FRT and ZMA, the modeled versions, then the min phase versions. File organization will be your friend.
Note for Response Modeler under Office 2013, I get this odd error message when closing the file.
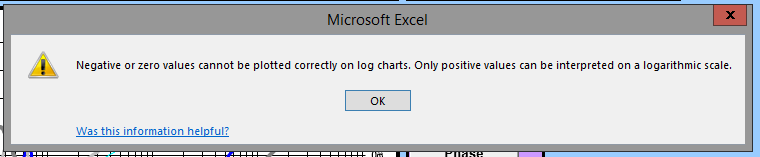
That appears to have no effect, just click OK and be done with it.
WinPCD
Now we have a set of FRD and ZMA files with all the cabinet interactions included that will be used to design your crossover to get the best frequency response possible. The two primary goals I seek during this exercise are:
- Minimum frequency response variation
- Phase alignment as one speaker hands off to another
If you manage to hit those two goals with your design you’ll have a pretty darn good speaker. Of course, there are a whole lot of other things that go into a truly great speaker that we won’t address here, like off axis response, time alignment, constant directivity, and other things left to the exceptionally nerdy. Trust me, this article only scratches the surface of the depths of speaker nerdery.
 Once you install and open WinPCD, you’ll be greeted with a more compact but equally confusing interface. Again, don’t panic! First off, the top left has a path, this isn’t required to be set, but it will make it easier to find your FRD and ZMA files if you’ve saved them all in an organized location.
Click where it says “C:\” and navigate to your folder.
Next, add some descriptions to your project for later, a name, comments, models of the drivers, whatever you feel the need to complete.
For each driver, click the Load FRD and ZMA buttons to pull in your fully modeled and minimum phase extracted files.
Next, pick your crossover type from the list.
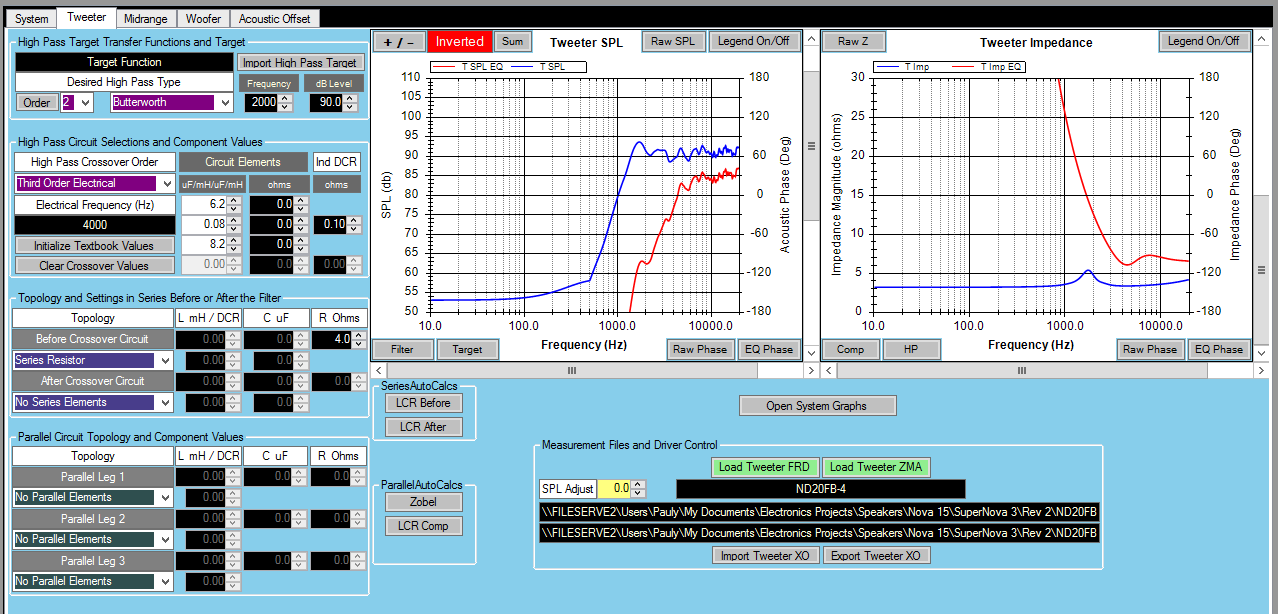 Now, we’ll focus on each of the driver tabs to continue, starting with the tweeter. Here, there are a whole lot of things you can do. First thing, Select your target function for Butterworth, Bessel, LinkwitzRiley, etc. At this point the target order doesn’t seem to be important yet, so move down to the circuit selections and enter your desired order, and target frequency. The target frequency is important, look for where the speakers are naturally rolling off and go somewhere around there. Click the Initialize Textbook Values button to load typical values for the filter. Bam! The chart should now show your filter effect on the tweeter. The most common things to add to the filter, especially for tweeters and midranges are series elements to help match up your levels. Select the series elements in the topology section before and after the filter, we’ll play with these values to improve your design later.
 Next we’ll do the woofer. This is going to be very similar to the tweeter section in the way we pick the target, select the filter type, and initialize values.
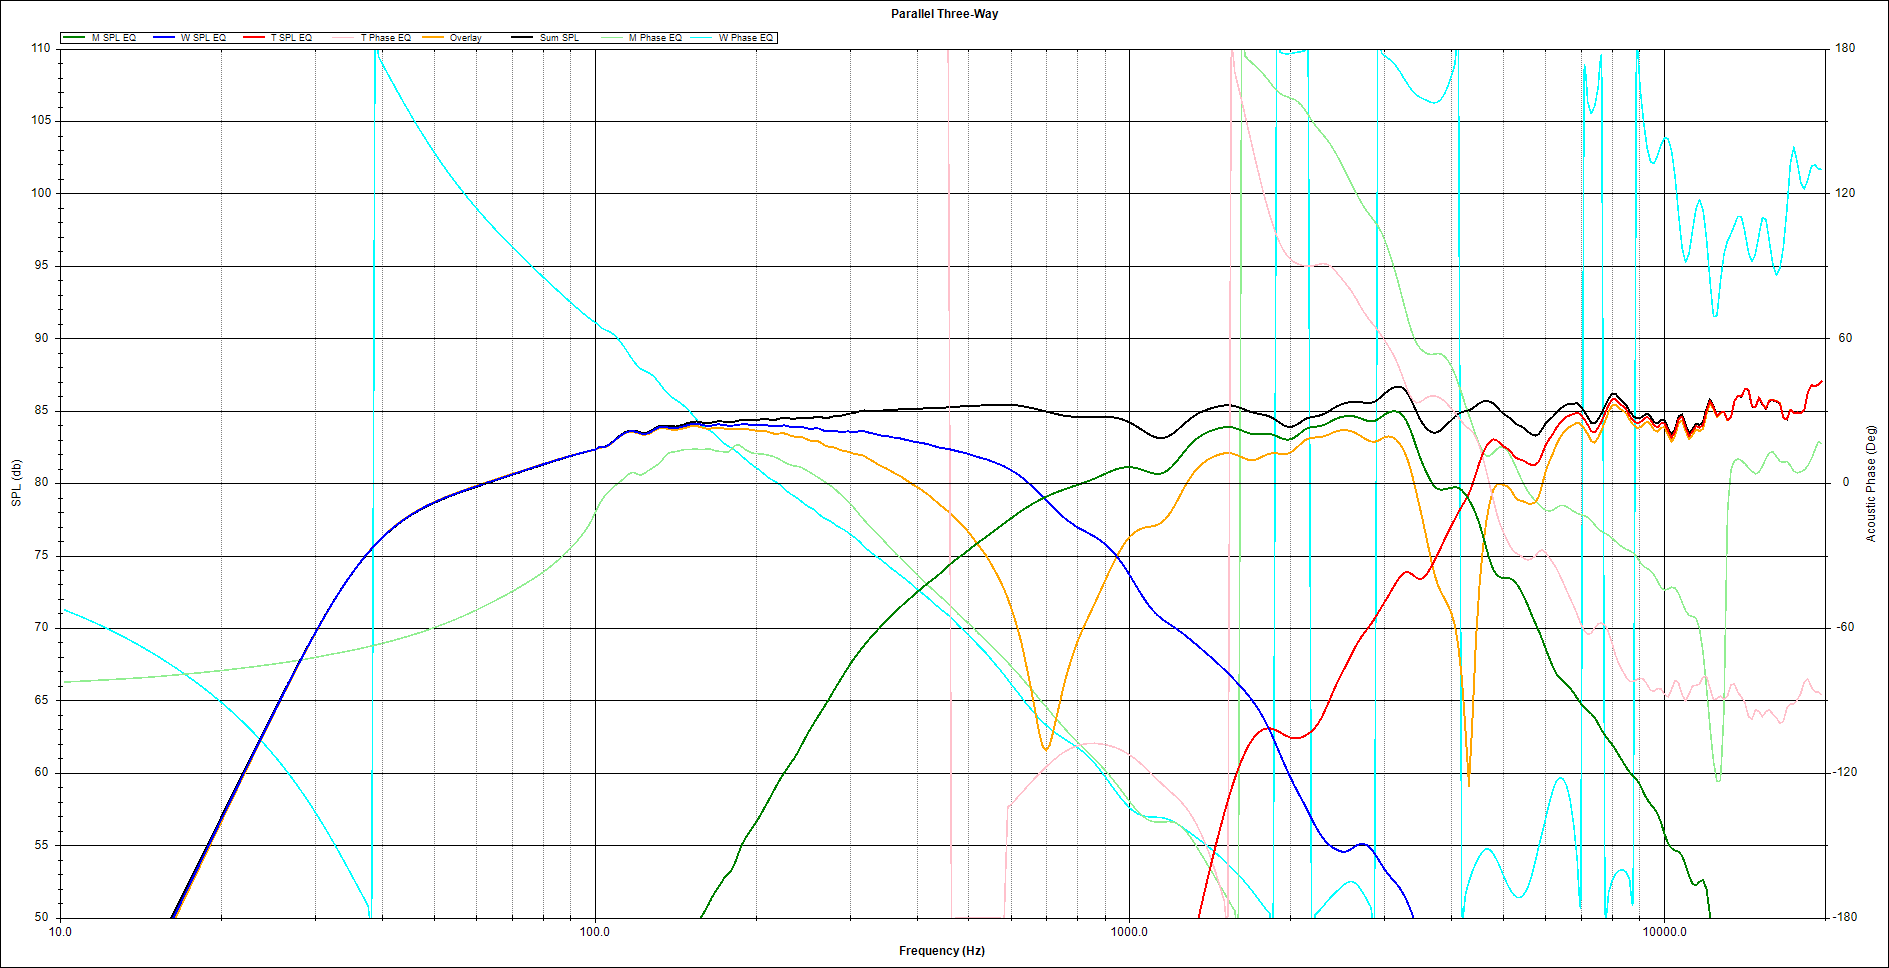
Then, if you’re brave enough to do a 3 way design, go for the midrange. For this driver, you have to target and initialize both a high and low pass filter, so it’s like doing the tweeter and woofer all over again on the same driver. Initialize the values, and off you go.
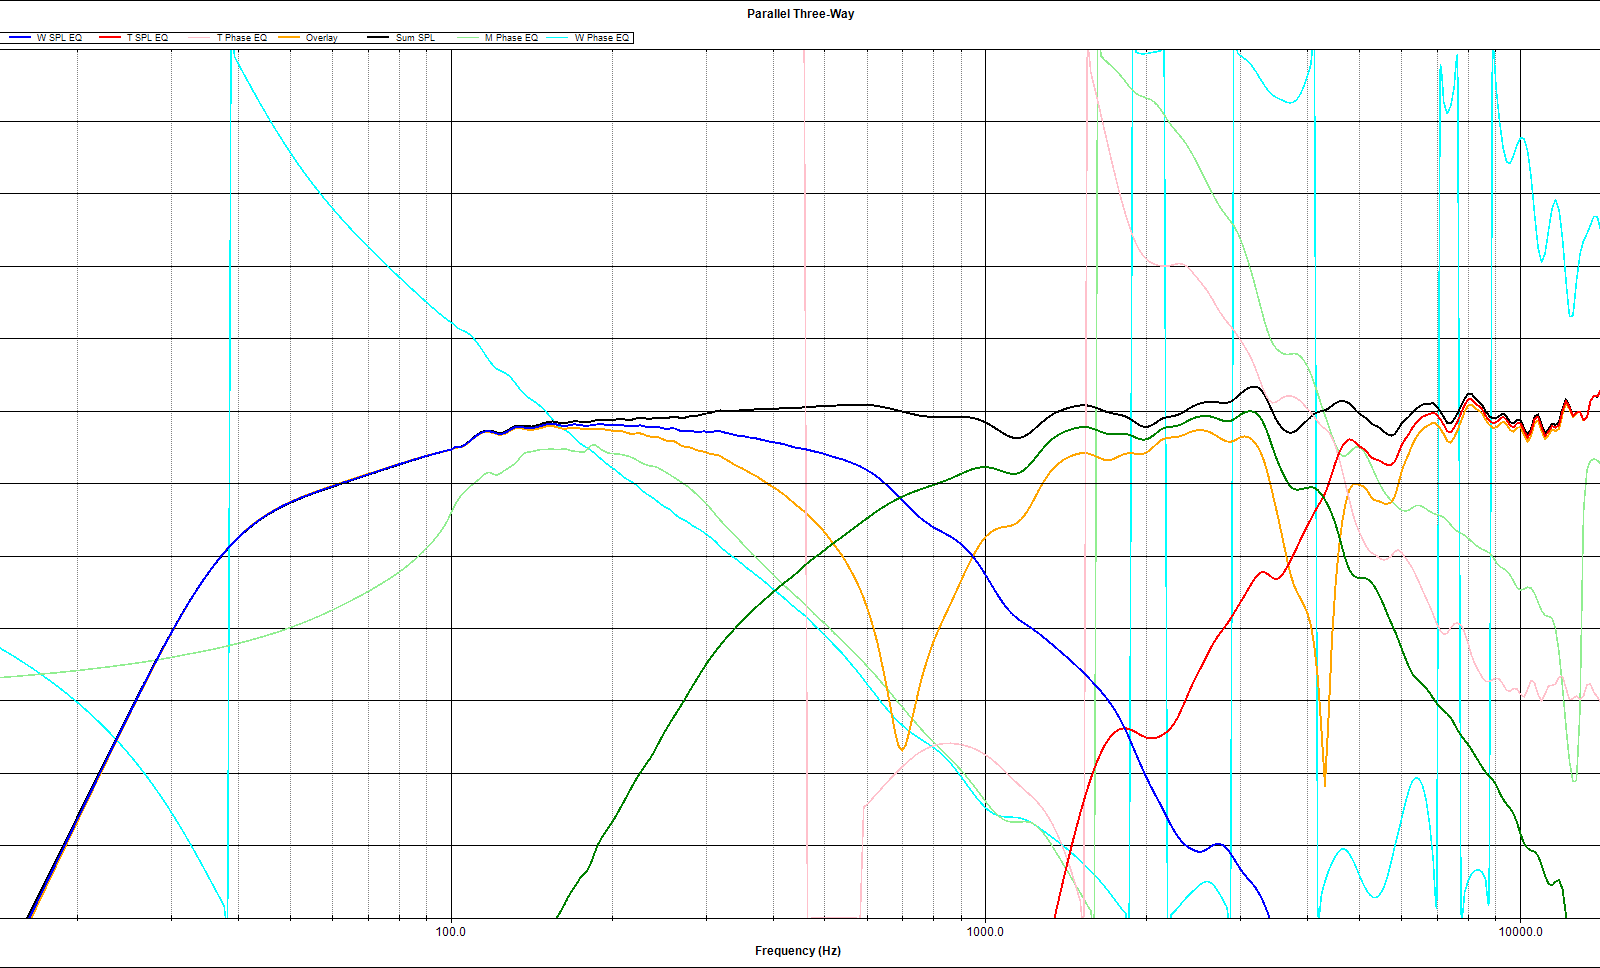
Back on the System tab, you can now pull up the whole system response charts, the schematic overlay of your crossover, and start adjusting to make it all work together. Chances are, if you simply used textbook values, your system response will look poor.
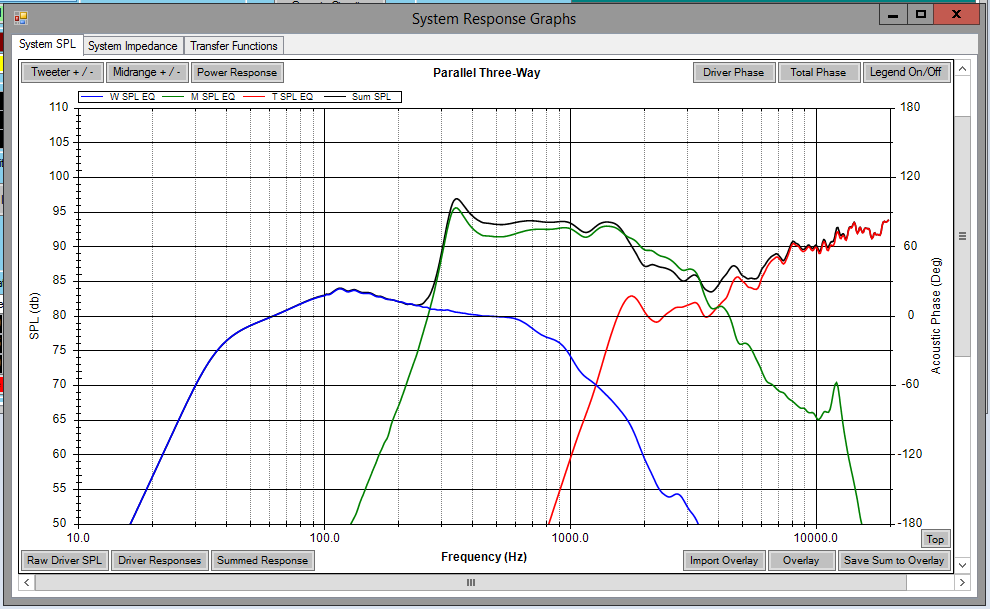
This is exactly why you’ll get yelled at in the internet forums for suggesting to use an off the shelf pre-designed crossover in your speaker. They simply do not know how your drivers will interact, so they use textbook values for simple resistance, and end up like that. When you spend time optimizing the crossover for the specific drivers and cabinet you’re building, the results for those same speakers can look more like this.
Phase Tracking
In addition to simply getting the frequency response under control, there’s the phase of the drivers to deal with. The important bit here is to try to get the driver phases as close as possible in the crossover region where one driver is handing off to the next. We’ll use a 2 way example for this bit for simplicity.
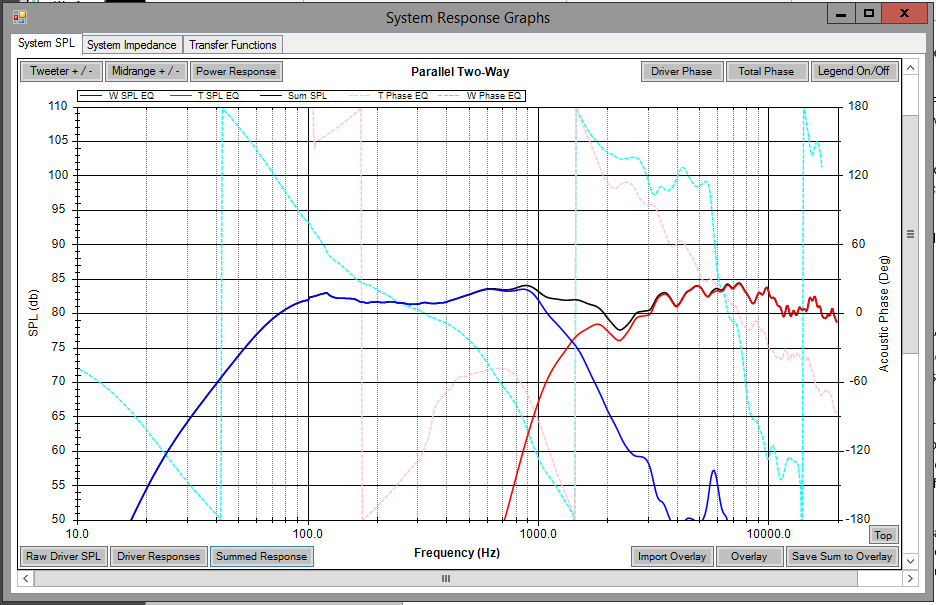
In this graph, you have to look closely at the pink and teal dotted lines for driver phase. You can see they vary a lot, but what we’re looking for is where they land near the crossover point. Look at around 1.5kHz, both the woofer and tweeter lines hit -180 degrees at the same point, then continue to fall back at the top of the graph. In this case, the slopes of the phase change is different, which could be improved, but they do meet very closely at the crossover point.

To test the phase match, invert the polarity of the tweeter by clicking the “Tweeter + / -“ button. You should see a sharp drop in the system response where the crossover point is we’ll call the reverse null, this indicates the drivers are 180 degrees out of phase at this point, and the sound is cancelling. The deeper the cancelation, the better the phase match. In a three way, you’ll have the woofer to mid to match, and the mid to tweeter. In that case, hitting the “Midrange + / -“ button will test both reverse nulls.
Try and Try Again
Now this is where trial and error kicks in. Fortunately, with WinPCD you can leave the graph on the screen and start changing values to see exactly how your response will be affected. Also, you’ll want to try different target functions, different crossover frequencies, and re-initialize the values multiple times to keep getting better. If you’re like me, you’ll end up clearing the whole damn thing and starting over several times before you’re satisfied.
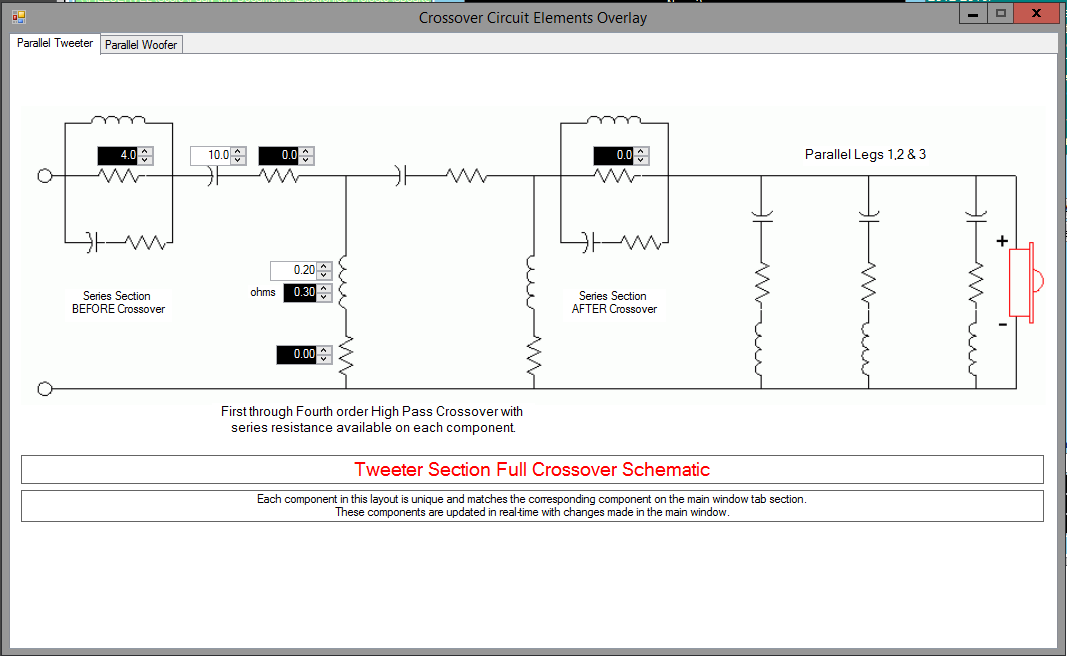 Once you’re close, I’ve found the schematic overlay screen to be super helpful.
On this screen, you can directly edit the values of your parts and watch what happens to your graphs. It’s a little easier to manage than the main screen where there’s a lot of additional information you don’t need to modify. From here, you can start to learn how the component values affect the response and phase, and start to hone in on your best design.
Off Axis Plotting, Dispersion
WinPCD has the nifty capability of plotting your response off axis, as the virtual microphone is moved left, right, up, or down from directly in front of your speaker. Cancellations, comb filtering, and loss in high frequency response or beaming will occur as you move about, and this is yet another input on how the speaker will eventually sound in real life.
To do this analysis, there is important data to enter. First, click the “Polar Inactive” button changing it to red. This will enable your offset data to be entered. At the bottom in the Baffle Geometry section, you’ll need to enter the relative dimensions of your speakers.
- Reference these to the tweeter, so the tweeter dimensions will be all 0
- Convert all dimensions to meters
The trickiest dimension will be the Z offset. This is the relative position of the effective acoustic radiating point of the drivers. A woofer will be behind the baffle typically, radiating somewhere around the center of the dust cap. There are methods to measure this accurately, provided on the Acoustic Offset tab, however that gets back in to having accurate measurement capabilities. In this case, I guestimated based on the driver dimensions.
The other piece of data to enter here is the Driver Piston Diameter in millimeters. This is important because the directivity of a speaker is determined by the relative length of the sound wave to the radiating area of the speaker.
Once you have these data points entered, you can perform the off-axis plots.
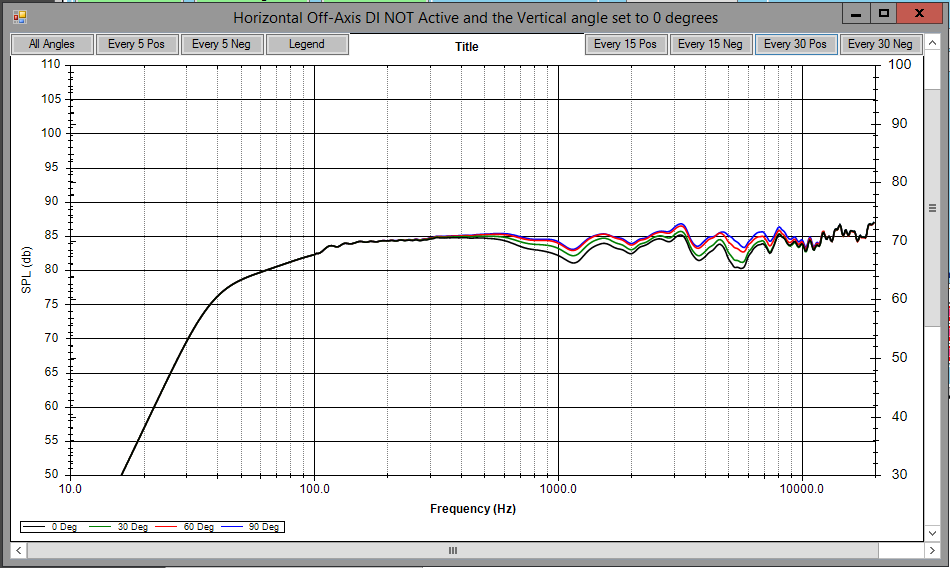

Note here that the horizontal response is pretty consistent while the vertical is all over the place. This is due to the driver arrangements. The speakers are arranged vertically in this example, as you move vertically the length between the ear and the speakers changes, causing cancellations when the phase shifts about. This is unavoidable physics, the reason speakers are typically arranged vertically like this is because the listening height is a lot less likely to be varied than the horizontal as seats are scattered across the room. Also, the only way to have significant effect on these measurements is to go back to the drawing board and re-layout your baffle. That will require going back to the top of the process and re-modeling your FRD / ZMA files in order to re-incorporate the new diffraction response.
Once you have your response close to perfected, you’ll want to start identifying actual component values you’ll use. To do this, start shopping. I like to run through Parts Express’s stock of components, make my choices as close to the model as possible, then update the model to use the actual values I can purchase. Remember to include the DC resistance of the inductors you are choosing, that will have an effect on the output. After a while you’ll start to remember the value increments you can find and use, and this will get easier.
Phase Tracking and Z Offset
Once you have your Z offset setup in the simulation software, you may notice that reversing the phase on the tweeter no longer produces that same null as it did before. This is due to the distance between your ears and the drivers, which adds minute time delays and affects the phase at the listening position. This should be accounted for in your design, which takes you back to the trial and error part in WinPCD.
To make sure you’re accounting for the offset in your simulation, make sure you have polar active selected and then tweak your values as described above to line back up your phase and get that nice deep reverse null back.
Simplifying your schematic in Xsim
At this point, you could just run with the WinPCD layout and values. However, if you’ve made some odd choices with the layout, or simply want a concise schematic to reference when you’re putting things together, XSim is really handy.
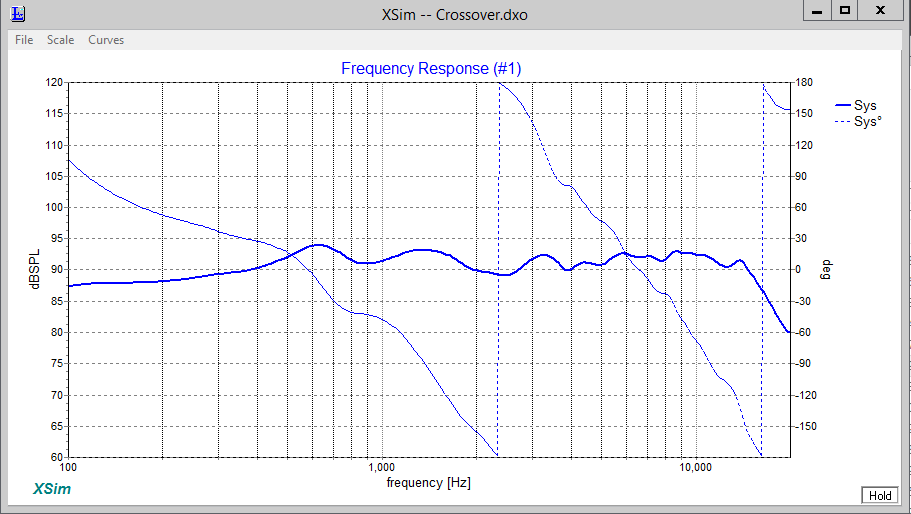
Once it’s installed and run, you’ll have a blank space to create your schematic from scratch. Use the buttons on the left to add your components. Double click them to change the values. Double click your drivers to apply the simulated FRD and ZMA files to them. To wire them up, just click and drag wires between the components. When you’ve got it all together, the response and impedance charts will show up. If you did it right, the chart will match the PCD version.
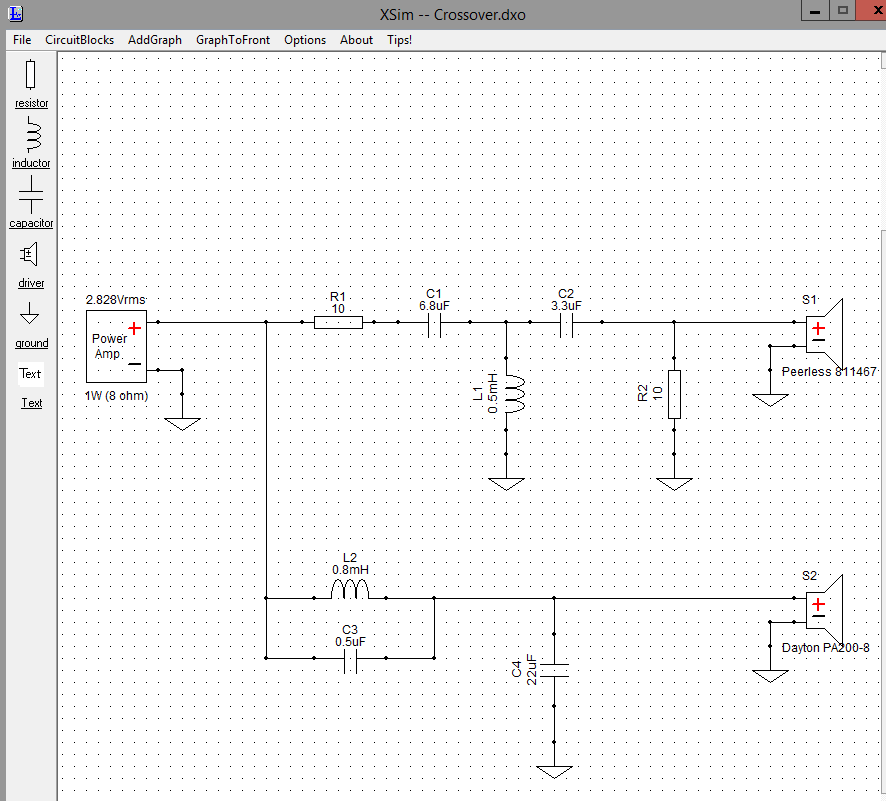
XSim will let you print your schematic, and you can use that to do your build.
Summing it up
This is one hell of a process, and these software tools are light years ahead of what was available to the DIY builder years ago. Be sure to join the forums, look at what others are doing, and learn all the information you can.
With this engineering design portion, and some slick woodworking, you’ll be able to quite easily build a set of speakers that will outperform anything you can buy at the big box stores (with the exception of some real high end expensive stuff), for less money in parts, excluding your own time in the design and build. A little cost savings + the satisfaction of building is what DIY is all about.
Pingback: SuperNova Minimus Speaker Build | The World of Wogg
Pingback: Anarchies Crossover Design | The World of Wogg